Enhanced ROC Analysis for Clinical Biomarker Evaluation
Source:vignettes/jsurvival-timeroc-comprehensive.Rmd
jsurvival-timeroc-comprehensive.RmdNote: The
timeroc()function is designed for use within jamovi’s GUI. The code examples below show the R syntax for reference. To run interactively, usedevtools::load_all()and call the R6 class directly:timerocClass$new(options = timerocOptions$new(...), data = mydata).
Enhanced ROC Analysis
1. Overview
The Enhanced ROC Analysis module
(timeroc) evaluates how well continuous biomarkers predict
clinical outcomes. It provides a dual-mode architecture:
-
Time-Dependent ROC (via
timeROCpackage): Evaluates marker performance at specific timepoints using cumulative/dynamic ROC curves with Inverse Probability of Censoring Weights (IPCW). -
General Binary ROC (via
pROCpackage): Standard diagnostic ROC for binary classification without a time component.
Key capabilities:
- IPCW weighting methods: Kaplan-Meier (marginal), Cox model, Aalen additive
- Asymptotic confidence intervals via influence functions
- Optimal cutoff calculation using Youden index
- Multi-marker comparison with DeLong, Bootstrap, or Venkatraman tests
- Clinical interpretation with severity-graded notices
Test Datasets
| Dataset | Description | N | Variables | Primary Use |
|---|---|---|---|---|
timeroc_test |
Breast cancer recurrence | 200 | PatientID, FollowUpMonths, Recurrence (0/1), RecurrenceFactor, Age, Stage, Ki67, GeneScore, NoiseMarker | Primary testing |
timeroc_cancer_biomarker |
General cancer biomarkers | varies | Multiple continuous markers | Extended testing |
timeroc_multi_biomarker |
Multi-marker scenarios | varies | Multiple markers for comparison | ROC comparison |
timeroc_edge_cases |
Edge case scenarios | varies | Designed extremes | Edge case testing |
2. Basic Time-Dependent ROC
The default mode evaluates how a marker discriminates events from non-events at specific follow-up timepoints. The timeROC package computes cumulative/dynamic AUC with IPCW correction for censoring.
data("timeroc_test")
timeroc(
data = timeroc_test,
elapsedtime = "FollowUpMonths",
outcome = "Recurrence",
outcomeLevel = "1",
marker = "Ki67",
analysisType = "timedep",
timepoints = "12, 36, 60",
method = "marginal",
bootstrapCI = FALSE,
plotROC = TRUE,
plotAUC = TRUE,
showOptimalCutoff = TRUE,
showMarkerStats = TRUE,
timetypeoutput = "months"
)
#>
#> TIME-DEPENDENT ROC ANALYSIS
#>
#> <div style='margin: 10px 0;'><div style='background-color: #eff6ff;
#> border-left: 4px solid #93c5fd; padding: 12px; margin: 8px 0;
#> border-radius: 4px;'><strong style='color: #2563eb;'>Analysis Complete
#> <span style='color: #374151;'>Time-dependent ROC analysis completed.
#> 190 observations, 127 events (66.8%), weighting: marginal.
#>
#> Time-Dependent ROC Analysis Results
#>
#> Marker Variable: Ki67
#>
#> Analysis Method: Cumulative/Dynamic (Kaplan-Meier weighting)
#>
#> Sample Size: 190 observations, 127 events (66.8%)
#>
#> AUC Interpretation by Timepoint:
#>
#> At 12 months:
#>
#> AUC = 0.767 (95% CI: NA - NA)
#>
#> Performance: fair (0.70-0.79) (CI not available: enable Confidence
#> Intervals option)
#>
#> At 36 months:
#>
#> AUC = 0.765 (95% CI: NA - NA)
#>
#> Performance: fair (0.70-0.79) (CI not available: enable Confidence
#> Intervals option)
#>
#> At 60 months:
#>
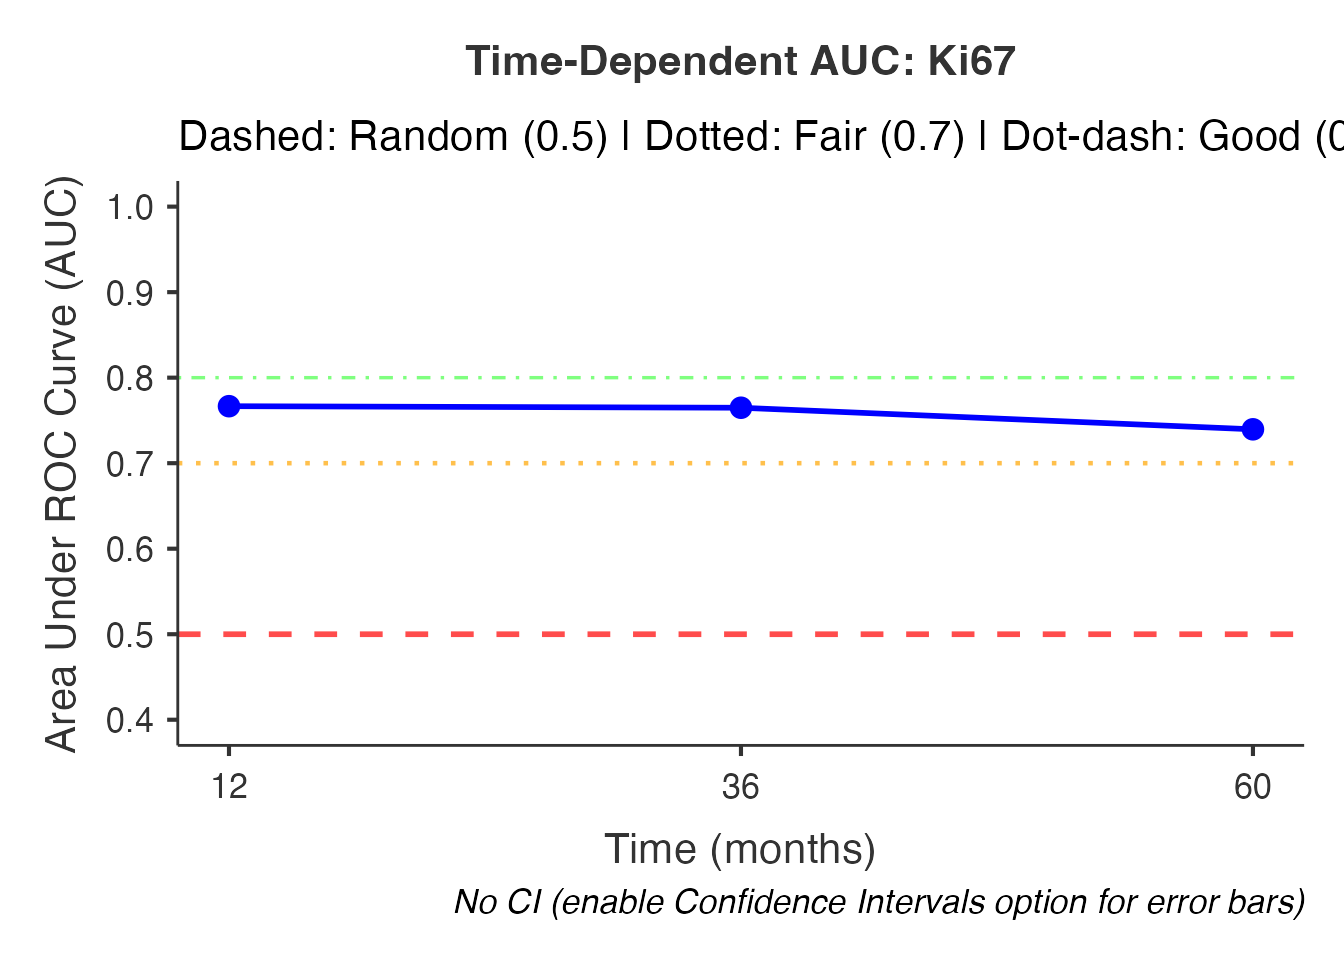
#> AUC = 0.740 (95% CI: NA - NA)
#>
#> Performance: fair (0.70-0.79) (CI not available: enable Confidence
#> Intervals option)
#>
#> Area Under ROC Curve (AUC)
#> ─────────────────────────────────────────────────────────────────
#> Timepoint AUC SE 95% CI Lower 95% CI Upper
#> ─────────────────────────────────────────────────────────────────
#> 12 0.7670000 NaN NaN NaN
#> 36 0.7650000 NaN NaN NaN
#> 60 0.7400000 NaN NaN NaN
#> ─────────────────────────────────────────────────────────────────
#>
#>
#> Marker Variable Statistics
#> ──────────────────────────
#> Statistic Value
#> ──────────────────────────
#> N 190
#> Mean 31.242
#> Median 30.45
#> SD 14.986
#> IQR 23.475
#> Min 1
#> Max 68.5
#> Events 127
#> Event Rate 66.8%
#> ──────────────────────────
#>
#>
#> Optimal Cutoff Values
#> ─────────────────────────────────────────────────────────────────────────────
#> Timepoint Optimal Cutoff Sensitivity Specificity Youden Index
#> ─────────────────────────────────────────────────────────────────────────────
#> ─────────────────────────────────────────────────────────────────────────────
#>
#>
#> Clinical Interpretation
#>
#>
#>
#> Overall Performance:
#>
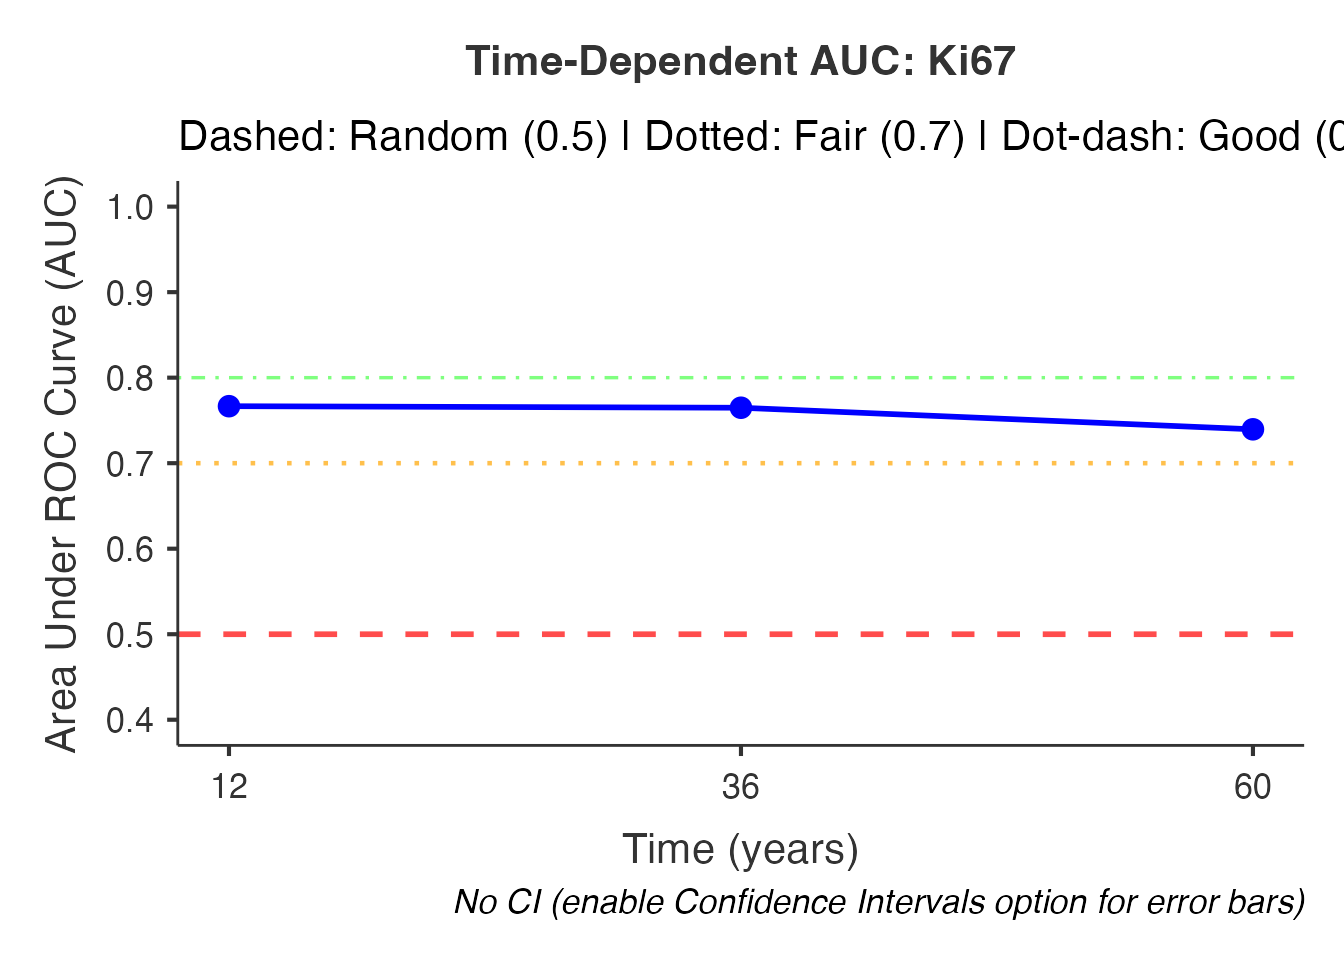
#> The Ki67 shows fair to good discriminative ability (mean AUC = 0.757).
#>
#>
#>
#> Time Trend:
#>
#> Performance shows a declining trend over time.
#>
#>
#>
#> Clinical Utility:
#>
#>
#> Best Performance: At 12 months (AUC = 0.767)
#> Threshold: AUC >= 0.70 is generally considered clinically useful
#> Assessment: The marker shows clinically relevant predictive ability
#>
#>
#>
#> Method: This analysis uses Kaplan-Meier (marginal) weighting for
#> censoring adjustment, appropriate when censoring is independent of
#> marker values.

What this produces:
- AUC table with values at months 12, 36, and 60
- ROC curves for each timepoint (one curve per timepoint)
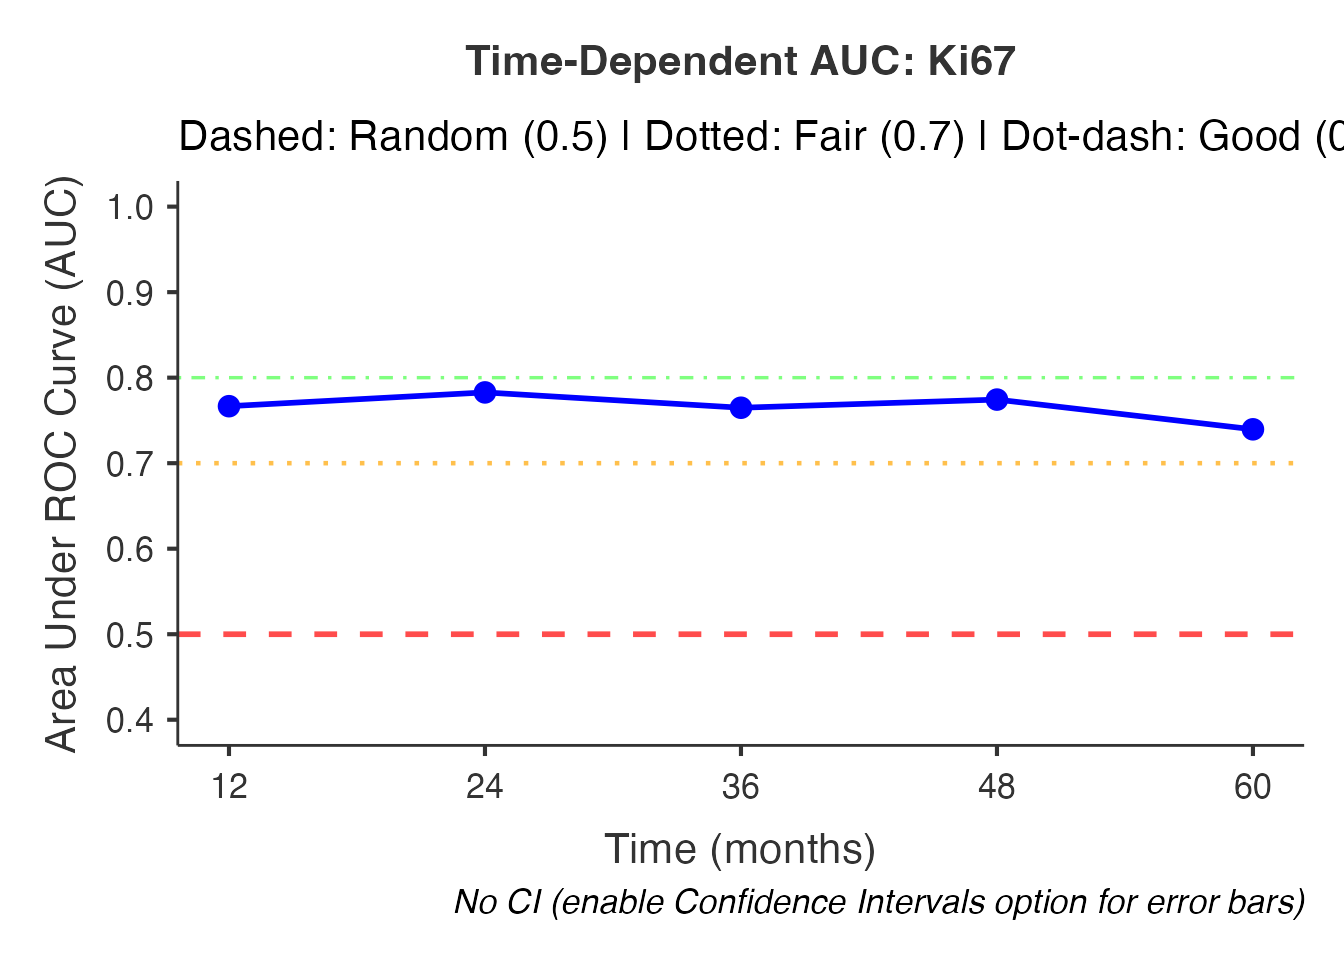
- AUC-over-time plot showing marker performance trajectory
- Marker descriptive statistics (N, mean, median, SD, IQR, range, events, event rate)
- Optimal cutoff table with Youden index for each timepoint
- Clinical interpretation text
3. IPCW Weighting Methods
The method option controls how censoring is handled via
Inverse Probability of Censoring Weights. Three approaches are
available:
3a. Kaplan-Meier (Marginal) Weighting
The default. Assumes censoring is independent of the marker. Uses the Kaplan-Meier estimator for censoring distribution.
timeroc(
  data = timeroc_test,
  elapsedtime = "FollowUpMonths",
  outcome = "Recurrence",
  outcomeLevel = "1",
  marker = "Ki67",
  analysisType = "timedep",
  method = "marginal",
  timepoints = "12, 36, 60",
  timetypeoutput = "months"
)
#>
#>  TIME-DEPENDENT ROC ANALYSIS
#>
#>  <div style='margin: 10px 0;'><div style='background-color: #eff6ff;
#>  border-left: 4px solid #93c5fd; padding: 12px; margin: 8px 0;
#>  border-radius: 4px;'><strong style='color: #2563eb;'>Analysis Complete
#>  <span style='color: #374151;'>Time-dependent ROC analysis completed.
#>  190 observations, 127 events (66.8%), weighting: marginal.
#>
#>  Time-Dependent ROC Analysis Results
#>
#>  Marker Variable: Ki67
#>
#>  Analysis Method: Cumulative/Dynamic (Kaplan-Meier weighting)
#>
#>  Sample Size: 190 observations, 127 events (66.8%)
#>
#>  AUC Interpretation by Timepoint:
#>
#>  At 12 months:
#>
#>  AUC = 0.767 (95% CI: NA - NA)
#>
#>  Performance: fair (0.70-0.79) (CI not available: enable Confidence
#>  Intervals option)
#>
#>  At 36 months:
#>
#>  AUC = 0.765 (95% CI: NA - NA)
#>
#>  Performance: fair (0.70-0.79) (CI not available: enable Confidence
#>  Intervals option)
#>
#>  At 60 months:
#>
#>  AUC = 0.740 (95% CI: NA - NA)
#>
#>  Performance: fair (0.70-0.79) (CI not available: enable Confidence
#>  Intervals option)
#>
#>  Area Under ROC Curve (AUC)
#>  ─────────────────────────────────────────────────────────────────
#>    Timepoint    AUC          SE     95% CI Lower    95% CI Upper
#>  ─────────────────────────────────────────────────────────────────
#>           12    0.7670000    NaN             NaN             NaN
#>           36    0.7650000    NaN             NaN             NaN
#>           60    0.7400000    NaN             NaN             NaN
#>  ─────────────────────────────────────────────────────────────────
#>
#>
#>  Marker Variable Statistics
#>  ──────────────────────────
#>    Statistic     Value
#>  ──────────────────────────
#>    N             190
#>    Mean          31.242
#>    Median        30.45
#>    SD            14.986
#>    IQR           23.475
#>    Min           1
#>    Max           68.5
#>    Events        127
#>    Event Rate    66.8%
#>  ──────────────────────────
#>
#>
#>  Optimal Cutoff Values
#>  ─────────────────────────────────────────────────────────────────────────────
#>    Timepoint    Optimal Cutoff    Sensitivity    Specificity    Youden Index
#>  ─────────────────────────────────────────────────────────────────────────────
#>  ─────────────────────────────────────────────────────────────────────────────
#>
#>
#>  Clinical Interpretation
#>
#>
#>
#>  Overall Performance:
#>
#>  The Ki67 shows fair to good discriminative ability (mean AUC = 0.757).
#>
#>
#>
#>  Time Trend:
#>
#>  Performance shows a declining trend over time.
#>
#>
#>
#>  Clinical Utility:
#>
#>
#>  Best Performance: At 12 months (AUC = 0.767)
#>  Threshold: AUC >= 0.70 is generally considered clinically useful
#>  Assessment: The marker shows clinically relevant predictive ability
#>
#>
#>
#>  Method: This analysis uses Kaplan-Meier (marginal) weighting for
#>  censoring adjustment, appropriate when censoring is independent of
#>  marker values.
3b. Cox Model Weighting
Uses a Cox proportional hazards model for censoring. Appropriate when censoring may depend on covariates (informative censoring).
timeroc(
  data = timeroc_test,
  elapsedtime = "FollowUpMonths",
  outcome = "Recurrence",
  outcomeLevel = "1",
  marker = "Ki67",
  analysisType = "timedep",
  method = "cox",
  timepoints = "12, 36, 60",
  timetypeoutput = "months"
)
#>
#>  TIME-DEPENDENT ROC ANALYSIS
#>
#>  <div style='margin: 10px 0;'><div style='background-color: #eff6ff;
#>  border-left: 4px solid #93c5fd; padding: 12px; margin: 8px 0;
#>  border-radius: 4px;'><strong style='color: #2563eb;'>Analysis Complete
#>  <span style='color: #374151;'>Time-dependent ROC analysis completed.
#>  190 observations, 127 events (66.8%), weighting: cox.
#>
#>  Time-Dependent ROC Analysis Results
#>
#>  Marker Variable: Ki67
#>
#>  Analysis Method: Cumulative/Dynamic (Cox model weighting)
#>
#>  Sample Size: 190 observations, 127 events (66.8%)
#>
#>  AUC Interpretation by Timepoint:
#>
#>  At 12 months:
#>
#>  AUC = 0.767 (95% CI: NA - NA)
#>
#>  Performance: fair (0.70-0.79) (CI not available: enable Confidence
#>  Intervals option)
#>
#>  At 36 months:
#>
#>  AUC = 0.770 (95% CI: NA - NA)
#>
#>  Performance: fair (0.70-0.79) (CI not available: enable Confidence
#>  Intervals option)
#>
#>  At 60 months:
#>
#>  AUC = 0.755 (95% CI: NA - NA)
#>
#>  Performance: fair (0.70-0.79) (CI not available: enable Confidence
#>  Intervals option)
#>
#>  Area Under ROC Curve (AUC)
#>  ─────────────────────────────────────────────────────────────────
#>    Timepoint    AUC          SE     95% CI Lower    95% CI Upper
#>  ─────────────────────────────────────────────────────────────────
#>           12    0.7670000    NaN             NaN             NaN
#>           36    0.7700000    NaN             NaN             NaN
#>           60    0.7550000    NaN             NaN             NaN
#>  ─────────────────────────────────────────────────────────────────
#>
#>
#>  Marker Variable Statistics
#>  ──────────────────────────
#>    Statistic     Value
#>  ──────────────────────────
#>    N             190
#>    Mean          31.242
#>    Median        30.45
#>    SD            14.986
#>    IQR           23.475
#>    Min           1
#>    Max           68.5
#>    Events        127
#>    Event Rate    66.8%
#>  ──────────────────────────
#>
#>
#>  Optimal Cutoff Values
#>  ─────────────────────────────────────────────────────────────────────────────
#>    Timepoint    Optimal Cutoff    Sensitivity    Specificity    Youden Index
#>  ─────────────────────────────────────────────────────────────────────────────
#>  ─────────────────────────────────────────────────────────────────────────────
#>
#>
#>  Clinical Interpretation
#>
#>
#>
#>  Overall Performance:
#>
#>  The Ki67 shows fair to good discriminative ability (mean AUC = 0.764).
#>
#>
#>
#>  Time Trend:
#>
#>  Performance shows a declining trend over time.
#>
#>
#>
#>  Clinical Utility:
#>
#>
#>  Best Performance: At 36 months (AUC = 0.770)
#>  Threshold: AUC >= 0.70 is generally considered clinically useful
#>  Assessment: The marker shows clinically relevant predictive ability
#>
#>
#>
#>  Method: This analysis uses Cox model-based IPCW weighting, which
#>  adjusts for covariates that may affect censoring.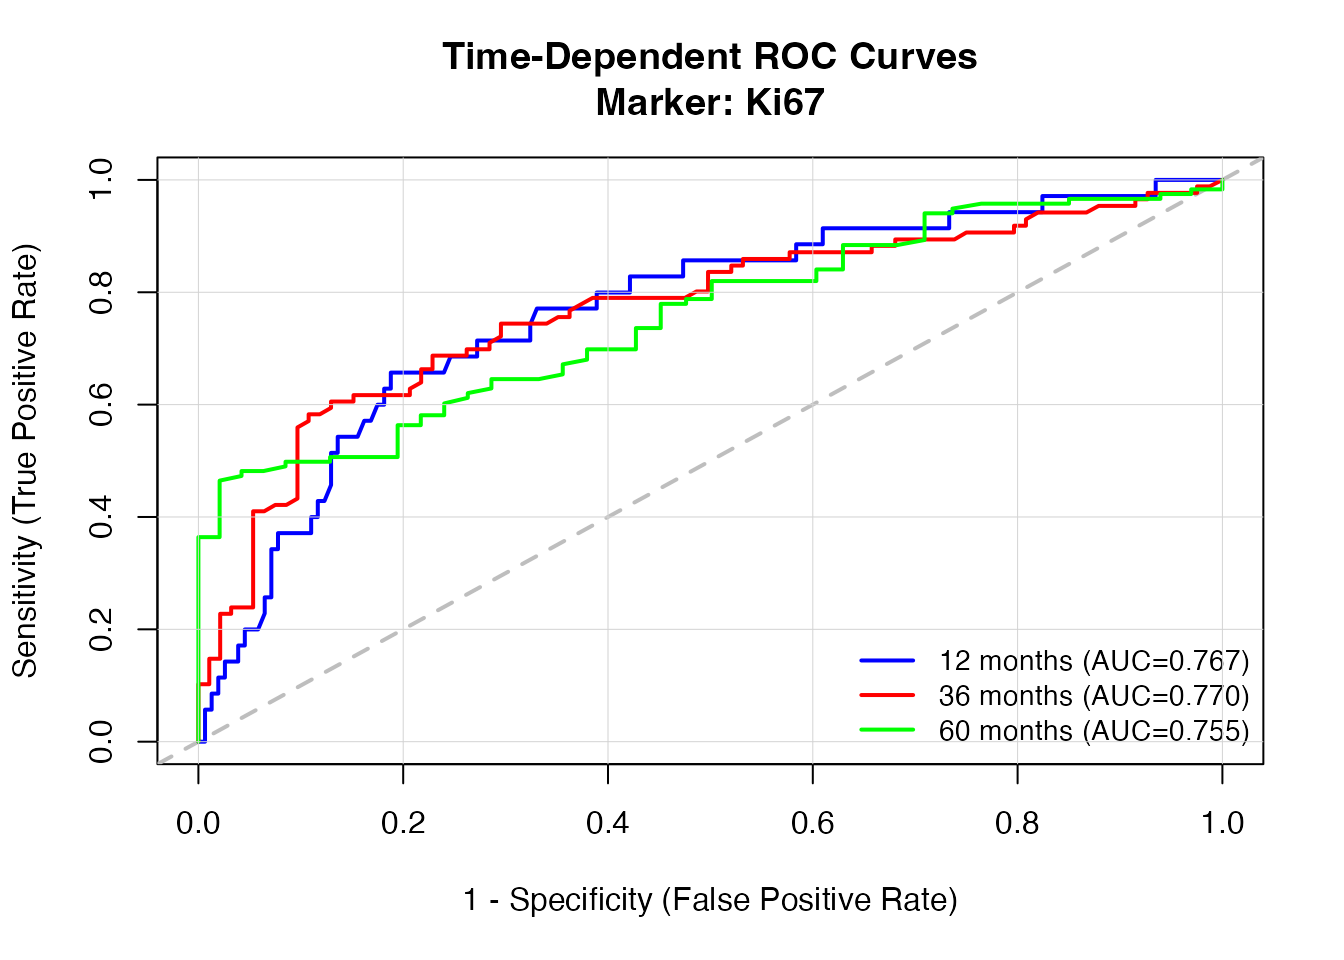

3c. Aalen Additive Model Weighting
Uses the Aalen additive hazards model. Provides flexible non-proportional adjustment for censoring.
timeroc(
data = timeroc_test,
elapsedtime = "FollowUpMonths",
outcome = "Recurrence",
outcomeLevel = "1",
marker = "Ki67",
analysisType = "timedep",
method = "aalen",
timepoints = "12, 36, 60",
timetypeoutput = "months"
)
#>
#> TIME-DEPENDENT ROC ANALYSIS
#>
#> <div style='margin: 10px 0;'><div style='background-color: #eff6ff;
#> border-left: 4px solid #93c5fd; padding: 12px; margin: 8px 0;
#> border-radius: 4px;'><strong style='color: #2563eb;'>Analysis Complete
#> <span style='color: #374151;'>Time-dependent ROC analysis completed.
#> 190 observations, 127 events (66.8%), weighting: aalen.
#>
#> Time-Dependent ROC Analysis Results
#>
#> Marker Variable: Ki67
#>
#> Analysis Method: Cumulative/Dynamic (Aalen model weighting)
#>
#> Sample Size: 190 observations, 127 events (66.8%)
#>
#> AUC Interpretation by Timepoint:
#>
#> At 12 months:
#>
#> AUC = 0.767 (95% CI: NA - NA)
#>
#> Performance: fair (0.70-0.79) (CI not available: enable Confidence
#> Intervals option)
#>
#> At 36 months:
#>
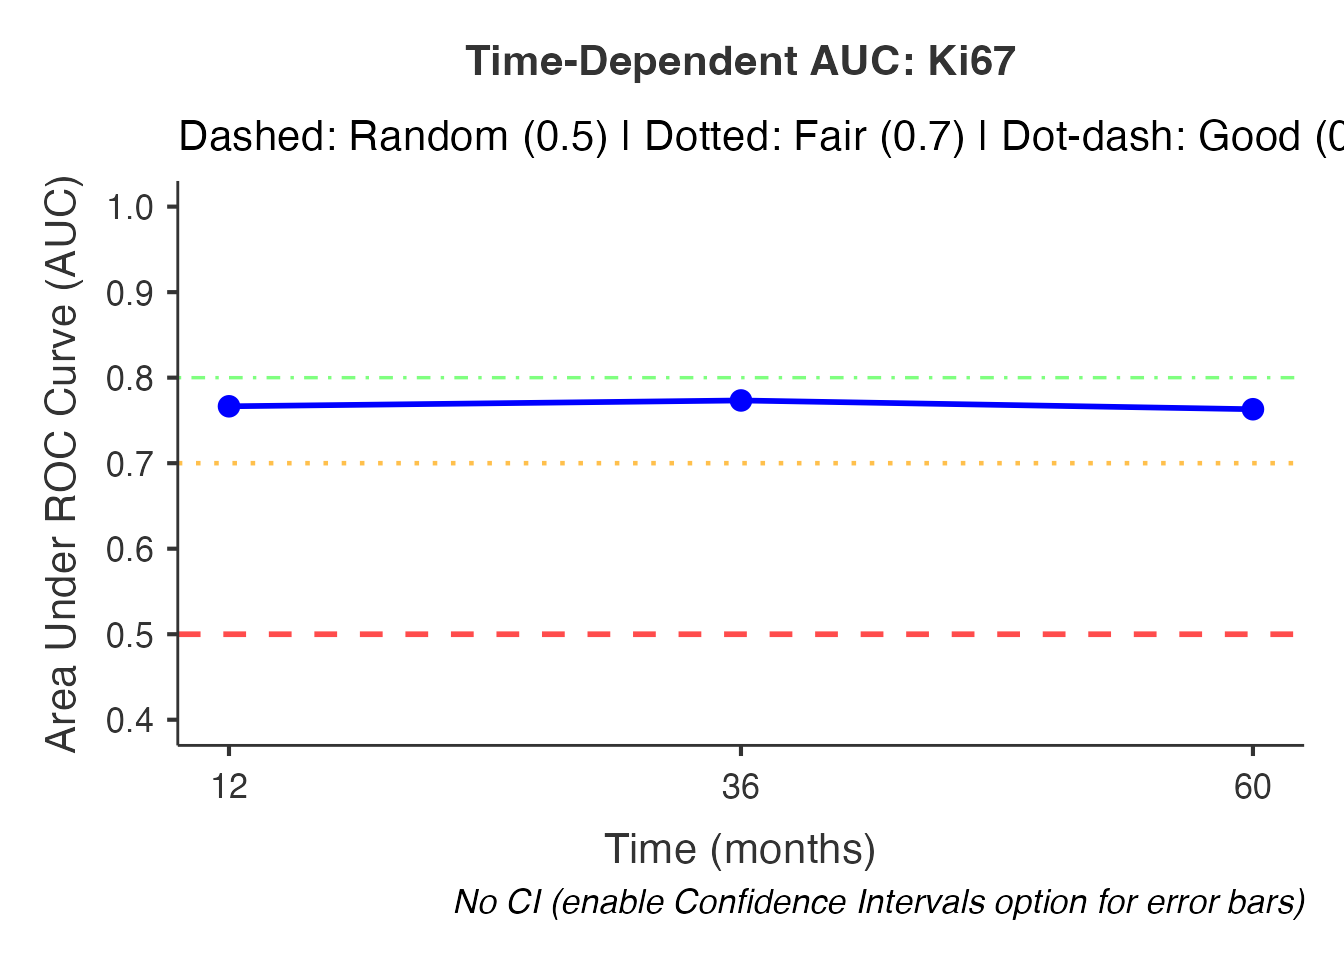
#> AUC = 0.773 (95% CI: NA - NA)
#>
#> Performance: fair (0.70-0.79) (CI not available: enable Confidence
#> Intervals option)
#>
#> At 60 months:
#>
#> AUC = 0.763 (95% CI: NA - NA)
#>
#> Performance: fair (0.70-0.79) (CI not available: enable Confidence
#> Intervals option)
#>
#> Area Under ROC Curve (AUC)
#> ─────────────────────────────────────────────────────────────────
#> Timepoint AUC SE 95% CI Lower 95% CI Upper
#> ─────────────────────────────────────────────────────────────────
#> 12 0.7670000 NaN NaN NaN
#> 36 0.7730000 NaN NaN NaN
#> 60 0.7630000 NaN NaN NaN
#> ─────────────────────────────────────────────────────────────────
#>
#>
#> Marker Variable Statistics
#> ──────────────────────────
#> Statistic Value
#> ──────────────────────────
#> N 190
#> Mean 31.242
#> Median 30.45
#> SD 14.986
#> IQR 23.475
#> Min 1
#> Max 68.5
#> Events 127
#> Event Rate 66.8%
#> ──────────────────────────
#>
#>
#> Optimal Cutoff Values
#> ─────────────────────────────────────────────────────────────────────────────
#> Timepoint Optimal Cutoff Sensitivity Specificity Youden Index
#> ─────────────────────────────────────────────────────────────────────────────
#> ─────────────────────────────────────────────────────────────────────────────
#>
#>
#> Clinical Interpretation
#>
#>
#>
#> Overall Performance:
#>
#> The Ki67 shows fair to good discriminative ability (mean AUC = 0.768).
#>
#>
#>
#> Time Trend:
#>
#> Performance shows a declining trend over time.
#>
#>
#>
#> Clinical Utility:
#>
#>
#> Best Performance: At 36 months (AUC = 0.773)
#> Threshold: AUC >= 0.70 is generally considered clinically useful
#> Assessment: The marker shows clinically relevant predictive ability
#>
#>
#>
#> Method: This analysis uses Aalen additive model for IPCW weighting,
#> providing flexible adjustment for censoring.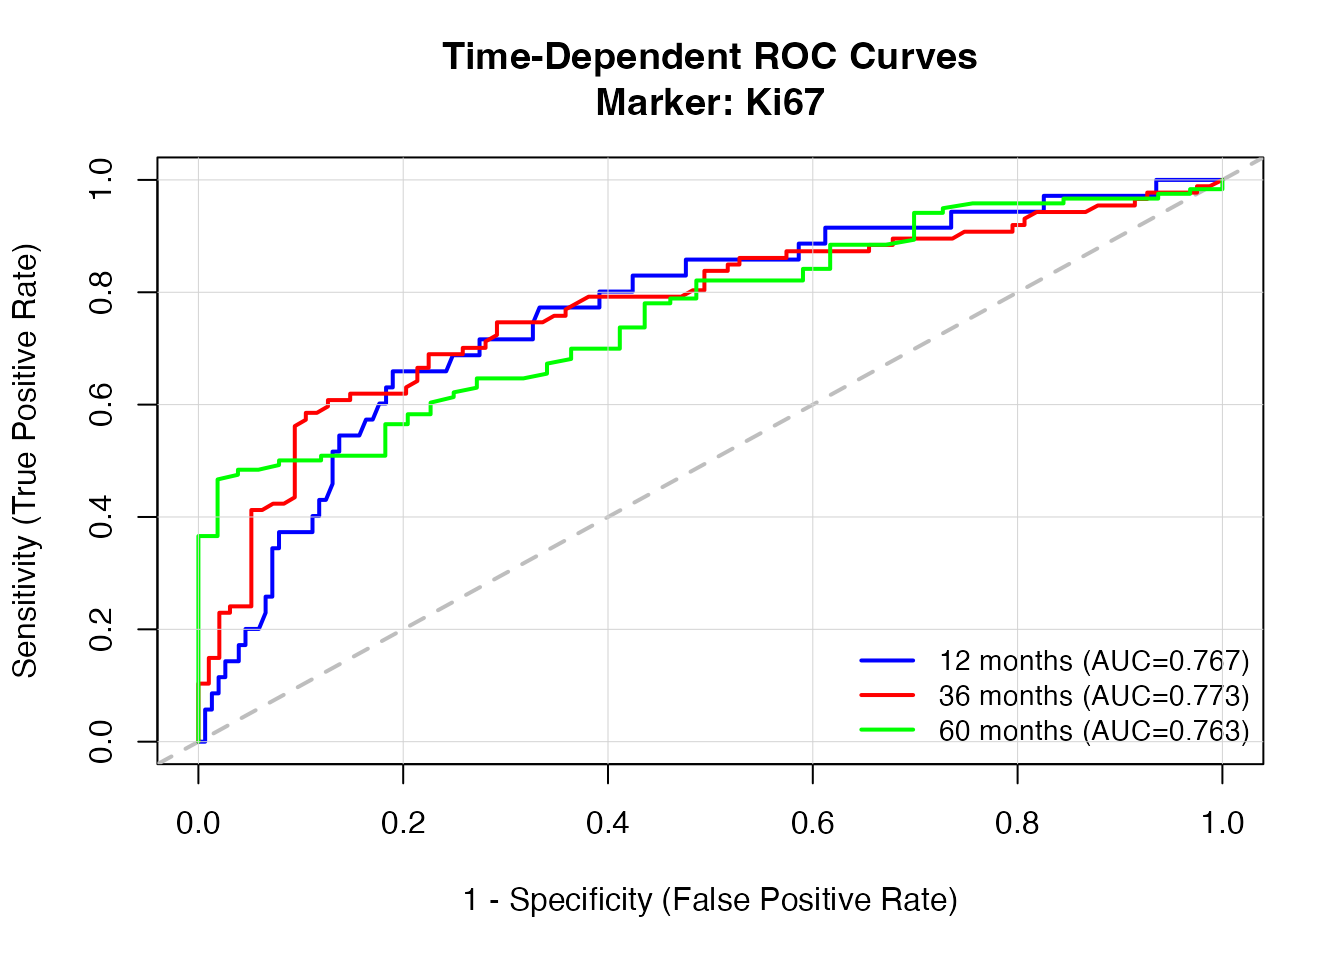
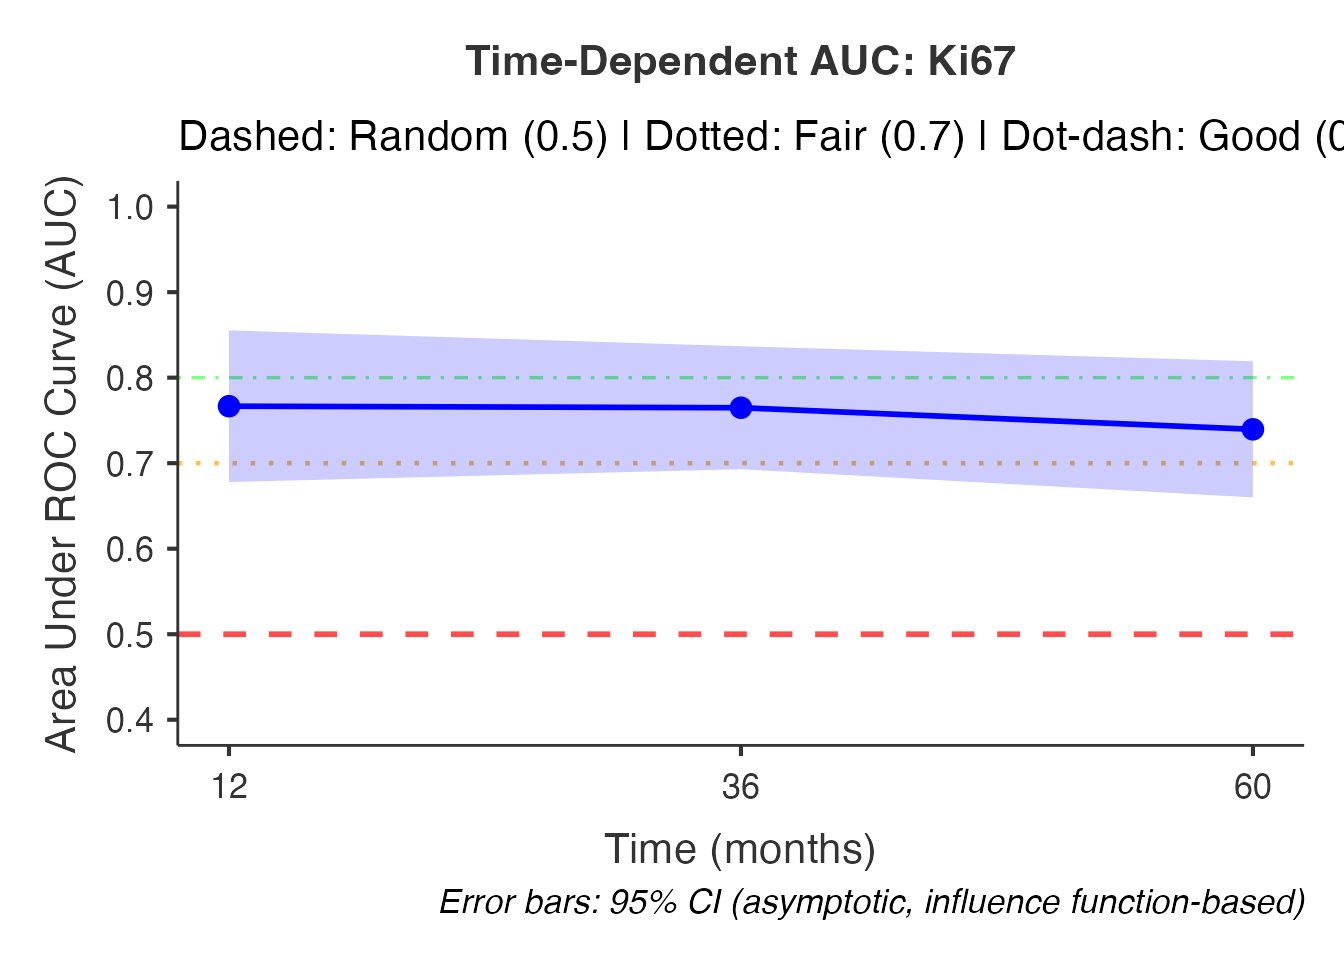
4. Confidence Intervals
Enable asymptotic confidence intervals using influence function-based variance estimation (not bootstrap, despite the option name). This computes the variance of the AUC estimator analytically and provides 95% CIs.
timeroc(
  data = timeroc_test,
  elapsedtime = "FollowUpMonths",
  outcome = "Recurrence",
  outcomeLevel = "1",
  marker = "Ki67",
  analysisType = "timedep",
  timepoints = "12, 36, 60",
  method = "marginal",
  bootstrapCI = TRUE,
  timetypeoutput = "months",
  plotAUC = TRUE
)
#>
#>  TIME-DEPENDENT ROC ANALYSIS
#>
#>  <div style='margin: 10px 0;'><div style='background-color: #eff6ff;
#>  border-left: 4px solid #93c5fd; padding: 12px; margin: 8px 0;
#>  border-radius: 4px;'><strong style='color: #2563eb;'>Analysis Complete
#>  <span style='color: #374151;'>Time-dependent ROC analysis completed.
#>  190 observations, 127 events (66.8%), weighting: marginal.
#>
#>  Time-Dependent ROC Analysis Results
#>
#>  Marker Variable: Ki67
#>
#>  Analysis Method: Cumulative/Dynamic (Kaplan-Meier weighting)
#>
#>  Sample Size: 190 observations, 127 events (66.8%)
#>
#>  Confidence Intervals: Asymptotic (influence function-based)
#>
#>  AUC Interpretation by Timepoint:
#>
#>  At 12 months:
#>
#>  AUC = 0.767 (95% CI: 0.678 - 0.855)
#>
#>  Performance: fair (0.70-0.79) (p = 0.000, significantly better than
#>  chance)
#>
#>  At 36 months:
#>
#>  AUC = 0.765 (95% CI: 0.693 - 0.837)
#>
#>  Performance: fair (0.70-0.79) (p = 0.000, significantly better than
#>  chance)
#>
#>  At 60 months:
#>
#>  AUC = 0.740 (95% CI: 0.660 - 0.819)
#>
#>  Performance: fair (0.70-0.79) (p = 0.000, significantly better than
#>  chance)
#>
#>  Area Under ROC Curve (AUC)
#>  ────────────────────────────────────────────────────────────────────────
#>    Timepoint    AUC          SE            95% CI Lower    95% CI Upper
#>  ────────────────────────────────────────────────────────────────────────
#>           12    0.7670000    0.04500000       0.6780000       0.8550000
#>           36    0.7650000    0.03700000       0.6920000       0.8370000
#>           60    0.7400000    0.04100000       0.6590000       0.8200000
#>  ────────────────────────────────────────────────────────────────────────
#>
#>
#>  Marker Variable Statistics
#>  ──────────────────────────
#>    Statistic     Value
#>  ──────────────────────────
#>    N             190
#>    Mean          31.242
#>    Median        30.45
#>    SD            14.986
#>    IQR           23.475
#>    Min           1
#>    Max           68.5
#>    Events        127
#>    Event Rate    66.8%
#>  ──────────────────────────
#>
#>
#>  Optimal Cutoff Values
#>  ─────────────────────────────────────────────────────────────────────────────
#>    Timepoint    Optimal Cutoff    Sensitivity    Specificity    Youden Index
#>  ─────────────────────────────────────────────────────────────────────────────
#>  ─────────────────────────────────────────────────────────────────────────────
#>
#>
#>  Clinical Interpretation
#>
#>
#>
#>  Overall Performance:
#>
#>  The Ki67 shows fair to good discriminative ability (mean AUC = 0.757).
#>
#>
#>
#>  Time Trend:
#>
#>  Performance shows a declining trend over time.
#>
#>
#>
#>  Clinical Utility:
#>
#>
#>  Best Performance: At 12 months (AUC = 0.767)
#>  Threshold: AUC >= 0.70 is generally considered clinically useful
#>  Assessment: The marker shows clinically relevant predictive ability
#>
#>
#>
#>  Method: This analysis uses Kaplan-Meier (marginal) weighting for
#>  censoring adjustment, appropriate when censoring is independent of
#>  marker values.

With CI enabled:
- AUC table includes SE, 95% CI Lower, and 95% CI Upper columns
- AUC-over-time plot shows confidence ribbon
- Interpretation text includes p-values testing AUC against 0.5
- Model comparison (
compareBaseline) becomes fully functional
5. Binary ROC Analysis
Switch to general binary ROC (no time component needed) for standard
diagnostic evaluation. Uses the pROC package with
direction = "auto" to auto-detect whether higher or lower
marker values indicate cases.
timeroc(
  data = timeroc_test,
  outcome = "Recurrence",
  outcomeLevel = "1",
  marker = "GeneScore",
  analysisType = "binary",
  plotROC = TRUE,
  youdenIndex = TRUE
)
#>
#>  TIME-DEPENDENT ROC ANALYSIS
#>
#>  <div style='margin: 10px 0;'><div style='background-color: #eff6ff;
#>  border-left: 4px solid #93c5fd; padding: 12px; margin: 8px 0;
#>  border-radius: 4px;'><strong style='color: #2563eb;'>Analysis Complete
#>  <span style='color: #374151;'>Binary ROC analysis completed. 194
#>  observations, 126 events (64.9% event rate).
#>
#> character(0)
#>
#>  Binary ROC Analysis Results
#>  ────────────────────────────────────────────────────────────────────────────────────────────────────────────────────────
#>    Marker       AUC          SE            95% CI Lower    95% CI Upper    Sensitivity    Specificity    Optimal Cutoff
#>  ────────────────────────────────────────────────────────────────────────────────────────────────────────────────────────
#>    GeneScore    0.7570000    0.03400000       0.6900000       0.8240000      0.5160000      0.8820000          5.475000
#>  ────────────────────────────────────────────────────────────────────────────────────────────────────────────────────────
#>
#>
#>  Diagnostic Performance Summary
#>
#>  AUC: 0.757 (Fair discrimination)
#>
#>  95% CI: [0.69, 0.824]
#>
#>
#>
#>  Clinical Interpretation:
#>
#>
#>  An AUC of 0.757 indicates correct discrimination in 75.7% of randomly
#>  selected case-control pairs.
#>  The 95% CI suggests the true AUC lies between 0.69 and 0.824.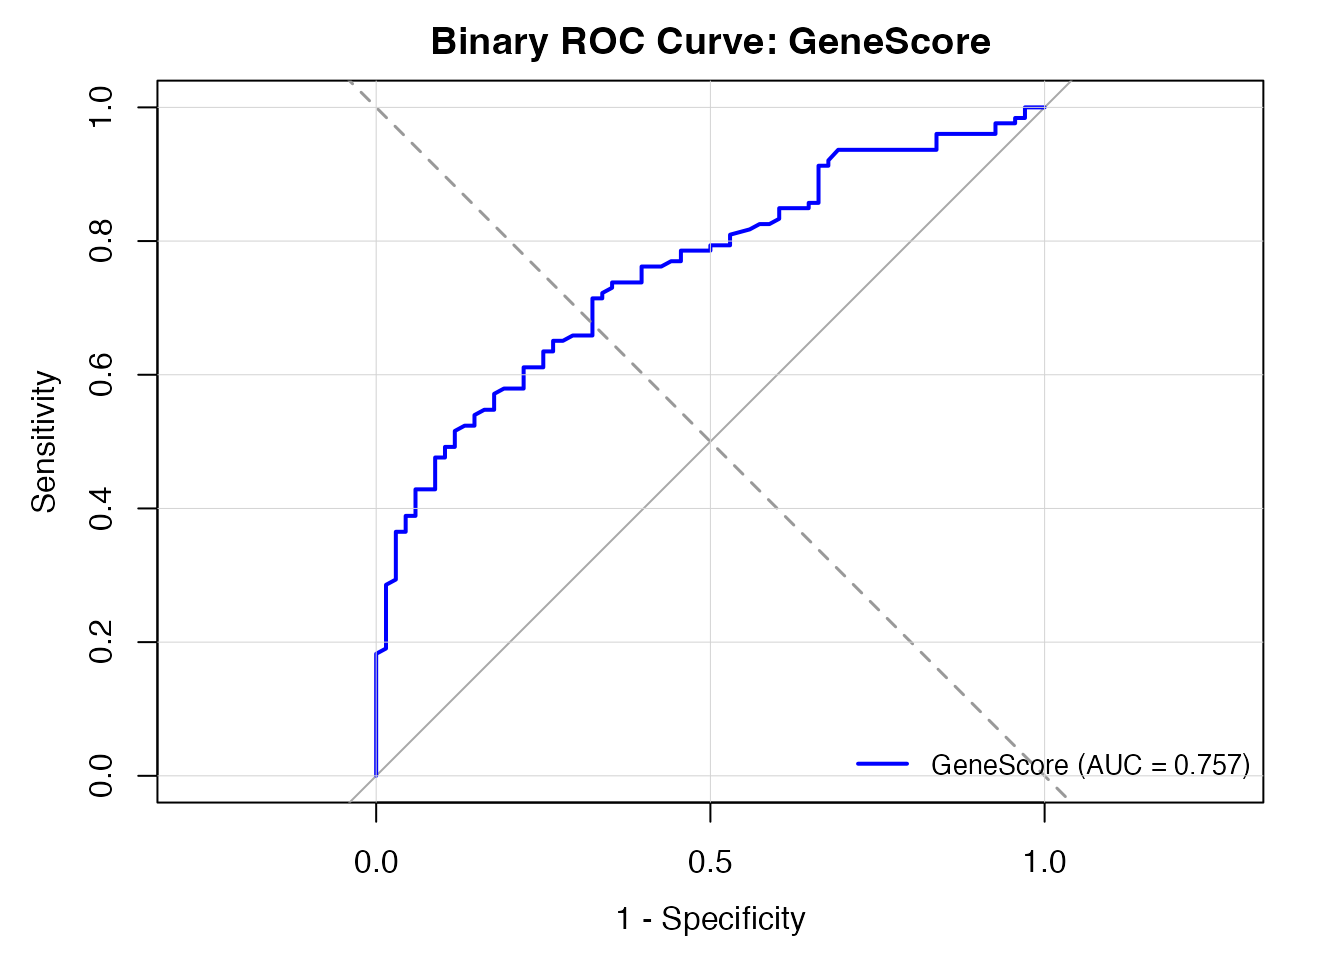
What this produces:
- Binary ROC table: AUC, SE, 95% CI, optimal cutoff, sensitivity, specificity
- Binary ROC curve plot with AUC in legend
- Diagnostic performance summary with clinical interpretation
- AUC classification: Excellent (>=0.9), Good (0.8-0.9), Fair (0.7-0.8), Poor (0.6-0.7), No discrimination (<0.6)
6. Factor Outcome with Level Selection
When the outcome is a factor (e.g., “Recurrence” / “No Recurrence”),
select the event level using outcomeLevel. The function
converts the factor to binary 0/1 internally.
timeroc(
  data = timeroc_test,
  elapsedtime = "FollowUpMonths",
  outcome = "RecurrenceFactor",
  outcomeLevel = "Recurrence",
  marker = "Ki67",
  analysisType = "timedep",
  timepoints = "12, 36, 60",
  timetypeoutput = "months"
)
#>
#>  TIME-DEPENDENT ROC ANALYSIS
#>
#>  <div style='margin: 10px 0;'><div style='background-color: #eff6ff;
#>  border-left: 4px solid #93c5fd; padding: 12px; margin: 8px 0;
#>  border-radius: 4px;'><strong style='color: #2563eb;'>Analysis Complete
#>  <span style='color: #374151;'>Time-dependent ROC analysis completed.
#>  190 observations, 127 events (66.8%), weighting: marginal.
#>
#>  Time-Dependent ROC Analysis Results
#>
#>  Marker Variable: Ki67
#>
#>  Analysis Method: Cumulative/Dynamic (Kaplan-Meier weighting)
#>
#>  Sample Size: 190 observations, 127 events (66.8%)
#>
#>  AUC Interpretation by Timepoint:
#>
#>  At 12 months:
#>
#>  AUC = 0.767 (95% CI: NA - NA)
#>
#>  Performance: fair (0.70-0.79) (CI not available: enable Confidence
#>  Intervals option)
#>
#>  At 36 months:
#>
#>  AUC = 0.765 (95% CI: NA - NA)
#>
#>  Performance: fair (0.70-0.79) (CI not available: enable Confidence
#>  Intervals option)
#>
#>  At 60 months:
#>
#>  AUC = 0.740 (95% CI: NA - NA)
#>
#>  Performance: fair (0.70-0.79) (CI not available: enable Confidence
#>  Intervals option)
#>
#>  Area Under ROC Curve (AUC)
#>  ─────────────────────────────────────────────────────────────────
#>    Timepoint    AUC          SE     95% CI Lower    95% CI Upper
#>  ─────────────────────────────────────────────────────────────────
#>           12    0.7670000    NaN             NaN             NaN
#>           36    0.7650000    NaN             NaN             NaN
#>           60    0.7400000    NaN             NaN             NaN
#>  ─────────────────────────────────────────────────────────────────
#>
#>
#>  Marker Variable Statistics
#>  ──────────────────────────
#>    Statistic     Value
#>  ──────────────────────────
#>    N             190
#>    Mean          31.242
#>    Median        30.45
#>    SD            14.986
#>    IQR           23.475
#>    Min           1
#>    Max           68.5
#>    Events        127
#>    Event Rate    66.8%
#>  ──────────────────────────
#>
#>
#>  Optimal Cutoff Values
#>  ─────────────────────────────────────────────────────────────────────────────
#>    Timepoint    Optimal Cutoff    Sensitivity    Specificity    Youden Index
#>  ─────────────────────────────────────────────────────────────────────────────
#>  ─────────────────────────────────────────────────────────────────────────────
#>
#>
#>  Clinical Interpretation
#>
#>
#>
#>  Overall Performance:
#>
#>  The Ki67 shows fair to good discriminative ability (mean AUC = 0.757).
#>
#>
#>
#>  Time Trend:
#>
#>  Performance shows a declining trend over time.
#>
#>
#>
#>  Clinical Utility:
#>
#>
#>  Best Performance: At 12 months (AUC = 0.767)
#>  Threshold: AUC >= 0.70 is generally considered clinically useful
#>  Assessment: The marker shows clinically relevant predictive ability
#>
#>
#>
#>  Method: This analysis uses Kaplan-Meier (marginal) weighting for
#>  censoring adjustment, appropriate when censoring is independent of
#>  marker values.

This also works in binary mode:
timeroc(
  data = timeroc_test,
  outcome = "RecurrenceFactor",
  outcomeLevel = "Recurrence",
  marker = "Ki67",
  analysisType = "binary",
  youdenIndex = TRUE
)
#>
#>  TIME-DEPENDENT ROC ANALYSIS
#>
#>  <div style='margin: 10px 0;'><div style='background-color: #eff6ff;
#>  border-left: 4px solid #93c5fd; padding: 12px; margin: 8px 0;
#>  border-radius: 4px;'><strong style='color: #2563eb;'>Analysis Complete
#>  <span style='color: #374151;'>Binary ROC analysis completed. 190
#>  observations, 127 events (66.8% event rate).
#>
#> character(0)
#>
#>  Binary ROC Analysis Results
#>  ─────────────────────────────────────────────────────────────────────────────────────────────────────────────────────
#>    Marker    AUC          SE            95% CI Lower    95% CI Upper    Sensitivity    Specificity    Optimal Cutoff
#>  ─────────────────────────────────────────────────────────────────────────────────────────────────────────────────────
#>    Ki67      0.7600000    0.03500000       0.6910000       0.8300000      0.6540000      0.7940000          30.35000
#>  ─────────────────────────────────────────────────────────────────────────────────────────────────────────────────────
#>
#>
#>  Diagnostic Performance Summary
#>
#>  AUC: 0.76 (Fair discrimination)
#>
#>  95% CI: [0.691, 0.83]
#>
#>
#>
#>  Clinical Interpretation:
#>
#>
#>  An AUC of 0.76 indicates correct discrimination in 76% of randomly
#>  selected case-control pairs.
#>  The 95% CI suggests the true AUC lies between 0.691 and 0.83.
7. ROC Comparison (DeLong Test)
Compare multiple markers against the primary marker using the DeLong test (default), bootstrap test, or Venkatraman test. This is available in binary ROC mode only.
7a. DeLong Test (Default)
timeroc(
  data = timeroc_test,
  outcome = "Recurrence",
  outcomeLevel = "1",
  marker = "Ki67",
  markers = c("GeneScore", "NoiseMarker"),
  analysisType = "binary",
  compareROCs = TRUE,
  rocComparison = "delong",
  plotROC = TRUE
)
#> Error:
#> ! Argument 'markers' requires a numeric variable ('GeneScore' is not valid)
What this produces:
- ROC comparison table: pairwise comparisons with test statistic, p-value, interpretation
- Multi-marker ROC plot: all curves overlaid with AUC in legend
- Individual entries in binary ROC table for the primary marker
7c. Venkatraman Test
timeroc(
  data = timeroc_test,
  outcome = "Recurrence",
  outcomeLevel = "1",
  marker = "Ki67",
  markers = c("GeneScore"),
  analysisType = "binary",
  compareROCs = TRUE,
  rocComparison = "venkatraman"
)
#> Error:
#> ! Argument 'markers' requires a numeric variable ('GeneScore' is not valid)
8. Optimal Cutoffs and Youden Index
Time-Dependent Mode
Optimal cutoffs are computed at each timepoint by maximizing the Youden index (sensitivity + specificity - 1) from the time-dependent ROC curve.
timeroc(
  data = timeroc_test,
  elapsedtime = "FollowUpMonths",
  outcome = "Recurrence",
  outcomeLevel = "1",
  marker = "Ki67",
  analysisType = "timedep",
  timepoints = "12, 24, 36, 48, 60",
  showOptimalCutoff = TRUE,
  timetypeoutput = "months"
)
#>
#>  TIME-DEPENDENT ROC ANALYSIS
#>
#>  <div style='margin: 10px 0;'><div style='background-color: #eff6ff;
#>  border-left: 4px solid #93c5fd; padding: 12px; margin: 8px 0;
#>  border-radius: 4px;'><strong style='color: #2563eb;'>Analysis Complete
#>  <span style='color: #374151;'>Time-dependent ROC analysis completed.
#>  190 observations, 127 events (66.8%), weighting: marginal.
#>
#>  Time-Dependent ROC Analysis Results
#>
#>  Marker Variable: Ki67
#>
#>  Analysis Method: Cumulative/Dynamic (Kaplan-Meier weighting)
#>
#>  Sample Size: 190 observations, 127 events (66.8%)
#>
#>  AUC Interpretation by Timepoint:
#>
#>  At 12 months:
#>
#>  AUC = 0.767 (95% CI: NA - NA)
#>
#>  Performance: fair (0.70-0.79) (CI not available: enable Confidence
#>  Intervals option)
#>
#>  At 24 months:
#>
#>  AUC = 0.783 (95% CI: NA - NA)
#>
#>  Performance: fair (0.70-0.79) (CI not available: enable Confidence
#>  Intervals option)
#>
#>  At 36 months:
#>
#>  AUC = 0.765 (95% CI: NA - NA)
#>
#>  Performance: fair (0.70-0.79) (CI not available: enable Confidence
#>  Intervals option)
#>
#>  At 48 months:
#>
#>  AUC = 0.774 (95% CI: NA - NA)
#>
#>  Performance: fair (0.70-0.79) (CI not available: enable Confidence
#>  Intervals option)
#>
#>  At 60 months:
#>
#>  AUC = 0.740 (95% CI: NA - NA)
#>
#>  Performance: fair (0.70-0.79) (CI not available: enable Confidence
#>  Intervals option)
#>
#>  Area Under ROC Curve (AUC)
#>  ─────────────────────────────────────────────────────────────────
#>    Timepoint    AUC          SE     95% CI Lower    95% CI Upper
#>  ─────────────────────────────────────────────────────────────────
#>           12    0.7670000    NaN             NaN             NaN
#>           24    0.7830000    NaN             NaN             NaN
#>           36    0.7650000    NaN             NaN             NaN
#>           48    0.7740000    NaN             NaN             NaN
#>           60    0.7400000    NaN             NaN             NaN
#>  ─────────────────────────────────────────────────────────────────
#>
#>
#>  Marker Variable Statistics
#>  ──────────────────────────
#>    Statistic     Value
#>  ──────────────────────────
#>    N             190
#>    Mean          31.242
#>    Median        30.45
#>    SD            14.986
#>    IQR           23.475
#>    Min           1
#>    Max           68.5
#>    Events        127
#>    Event Rate    66.8%
#>  ──────────────────────────
#>
#>
#>  Optimal Cutoff Values
#>  ─────────────────────────────────────────────────────────────────────────────
#>    Timepoint    Optimal Cutoff    Sensitivity    Specificity    Youden Index
#>  ─────────────────────────────────────────────────────────────────────────────
#>  ─────────────────────────────────────────────────────────────────────────────
#>
#>
#>  Clinical Interpretation
#>
#>
#>
#>  Overall Performance:
#>
#>  The Ki67 shows fair to good discriminative ability (mean AUC = 0.766).
#>
#>
#>
#>  Time Trend:
#>
#>  Performance shows a declining trend over time.
#>
#>
#>
#>  Clinical Utility:
#>
#>
#>  Best Performance: At 24 months (AUC = 0.783)
#>  Threshold: AUC >= 0.70 is generally considered clinically useful
#>  Assessment: The marker shows clinically relevant predictive ability
#>
#>
#>
#>  Method: This analysis uses Kaplan-Meier (marginal) weighting for
#>  censoring adjustment, appropriate when censoring is independent of
#>  marker values.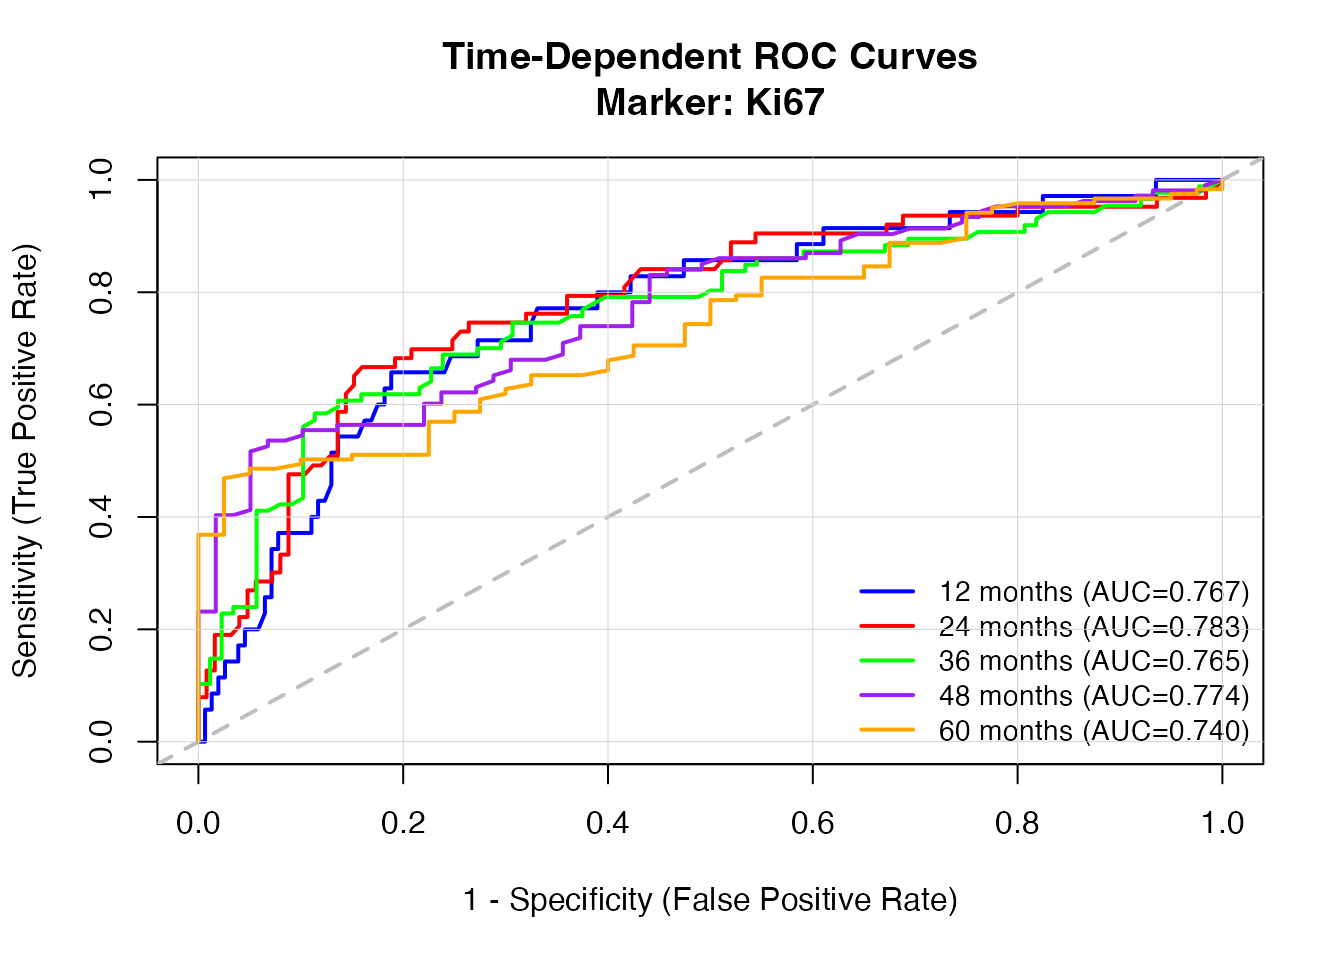
The cutoff table shows: timepoint, optimal cutoff value, sensitivity at cutoff, specificity at cutoff, and Youden index.
Binary Mode
In binary mode, the Youden index is calculated from the standard ROC
curve. Disable with youdenIndex = FALSE to suppress the
calculation.
timeroc(
  data = timeroc_test,
  outcome = "Recurrence",
  outcomeLevel = "1",
  marker = "Ki67",
  analysisType = "binary",
  youdenIndex = TRUE
)
#>
#>  TIME-DEPENDENT ROC ANALYSIS
#>
#>  <div style='margin: 10px 0;'><div style='background-color: #eff6ff;
#>  border-left: 4px solid #93c5fd; padding: 12px; margin: 8px 0;
#>  border-radius: 4px;'><strong style='color: #2563eb;'>Analysis Complete
#>  <span style='color: #374151;'>Binary ROC analysis completed. 190
#>  observations, 127 events (66.8% event rate).
#>
#> character(0)
#>
#>  Binary ROC Analysis Results
#>  ─────────────────────────────────────────────────────────────────────────────────────────────────────────────────────
#>    Marker    AUC          SE            95% CI Lower    95% CI Upper    Sensitivity    Specificity    Optimal Cutoff
#>  ─────────────────────────────────────────────────────────────────────────────────────────────────────────────────────
#>    Ki67      0.7600000    0.03500000       0.6910000       0.8300000      0.6540000      0.7940000          30.35000
#>  ─────────────────────────────────────────────────────────────────────────────────────────────────────────────────────
#>
#>
#>  Diagnostic Performance Summary
#>
#>  AUC: 0.76 (Fair discrimination)
#>
#>  95% CI: [0.691, 0.83]
#>
#>
#>
#>  Clinical Interpretation:
#>
#>
#>  An AUC of 0.76 indicates correct discrimination in 76% of randomly
#>  selected case-control pairs.
#>  The 95% CI suggests the true AUC lies between 0.691 and 0.83.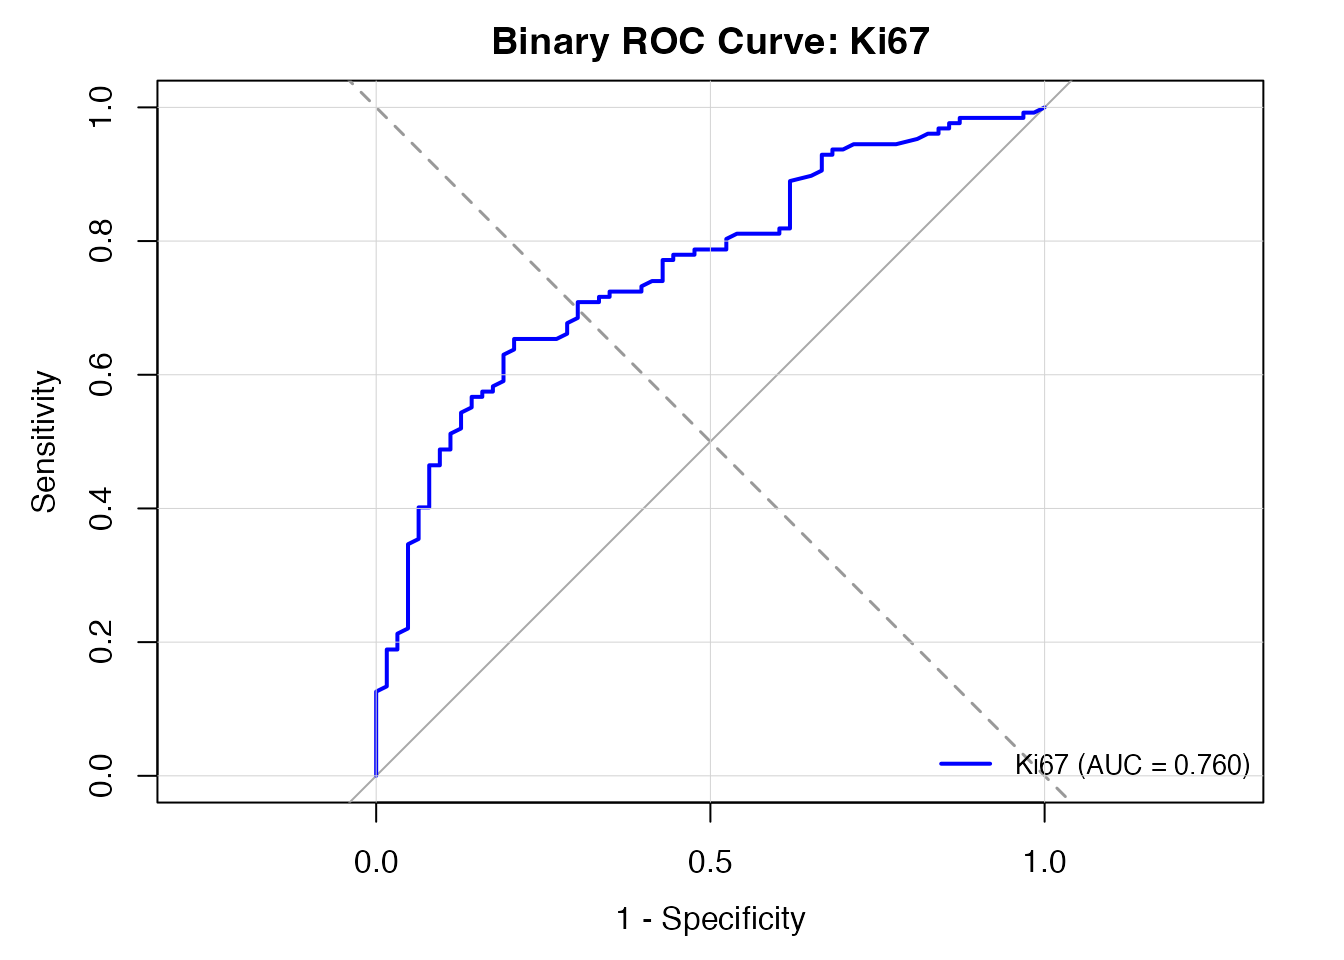
timeroc(
  data = timeroc_test,
  outcome = "Recurrence",
  outcomeLevel = "1",
  marker = "Ki67",
  analysisType = "binary",
  youdenIndex = FALSE
)
#>
#>  TIME-DEPENDENT ROC ANALYSIS
#>
#>  <div style='margin: 10px 0;'><div style='background-color: #eff6ff;
#>  border-left: 4px solid #93c5fd; padding: 12px; margin: 8px 0;
#>  border-radius: 4px;'><strong style='color: #2563eb;'>Analysis Complete
#>  <span style='color: #374151;'>Binary ROC analysis completed. 190
#>  observations, 127 events (66.8% event rate).
#>
#> character(0)
#>
#>  Binary ROC Analysis Results
#>  ─────────────────────────────────────────────────────────────────────────────────────────────────────────────────────
#>    Marker    AUC          SE            95% CI Lower    95% CI Upper    Sensitivity    Specificity    Optimal Cutoff
#>  ─────────────────────────────────────────────────────────────────────────────────────────────────────────────────────
#>    Ki67      0.7600000    0.03500000       0.6910000       0.8300000
#>  ─────────────────────────────────────────────────────────────────────────────────────────────────────────────────────
#>
#>
#>  Diagnostic Performance Summary
#>
#>  AUC: 0.76 (Fair discrimination)
#>
#>  95% CI: [0.691, 0.83]
#>
#>
#>
#>  Clinical Interpretation:
#>
#>
#>  An AUC of 0.76 indicates correct discrimination in 76% of randomly
#>  selected case-control pairs.
#>  The 95% CI suggests the true AUC lies between 0.691 and 0.83.
9. Display Options
9a. Marker Statistics
Toggle descriptive statistics for the marker variable (time-dependent mode).
timeroc(
  data = timeroc_test,
  elapsedtime = "FollowUpMonths",
  outcome = "Recurrence",
  outcomeLevel = "1",
  marker = "Ki67",
  analysisType = "timedep",
  showMarkerStats = FALSE,
  timepoints = "12, 36, 60",
  timetypeoutput = "months"
)
#>
#>  TIME-DEPENDENT ROC ANALYSIS
#>
#>  <div style='margin: 10px 0;'><div style='background-color: #eff6ff;
#>  border-left: 4px solid #93c5fd; padding: 12px; margin: 8px 0;
#>  border-radius: 4px;'><strong style='color: #2563eb;'>Analysis Complete
#>  <span style='color: #374151;'>Time-dependent ROC analysis completed.
#>  190 observations, 127 events (66.8%), weighting: marginal.
#>
#>  Time-Dependent ROC Analysis Results
#>
#>  Marker Variable: Ki67
#>
#>  Analysis Method: Cumulative/Dynamic (Kaplan-Meier weighting)
#>
#>  Sample Size: 190 observations, 127 events (66.8%)
#>
#>  AUC Interpretation by Timepoint:
#>
#>  At 12 months:
#>
#>  AUC = 0.767 (95% CI: NA - NA)
#>
#>  Performance: fair (0.70-0.79) (CI not available: enable Confidence
#>  Intervals option)
#>
#>  At 36 months:
#>
#>  AUC = 0.765 (95% CI: NA - NA)
#>
#>  Performance: fair (0.70-0.79) (CI not available: enable Confidence
#>  Intervals option)
#>
#>  At 60 months:
#>
#>  AUC = 0.740 (95% CI: NA - NA)
#>
#>  Performance: fair (0.70-0.79) (CI not available: enable Confidence
#>  Intervals option)
#>
#>  Area Under ROC Curve (AUC)
#>  ─────────────────────────────────────────────────────────────────
#>    Timepoint    AUC          SE     95% CI Lower    95% CI Upper
#>  ─────────────────────────────────────────────────────────────────
#>           12    0.7670000    NaN             NaN             NaN
#>           36    0.7650000    NaN             NaN             NaN
#>           60    0.7400000    NaN             NaN             NaN
#>  ─────────────────────────────────────────────────────────────────
#>
#>
#>  Optimal Cutoff Values
#>  ─────────────────────────────────────────────────────────────────────────────
#>    Timepoint    Optimal Cutoff    Sensitivity    Specificity    Youden Index
#>  ─────────────────────────────────────────────────────────────────────────────
#>  ─────────────────────────────────────────────────────────────────────────────
#>
#>
#>  Clinical Interpretation
#>
#>
#>
#>  Overall Performance:
#>
#>  The Ki67 shows fair to good discriminative ability (mean AUC = 0.757).
#>
#>
#>
#>  Time Trend:
#>
#>  Performance shows a declining trend over time.
#>
#>
#>
#>  Clinical Utility:
#>
#>
#>  Best Performance: At 12 months (AUC = 0.767)
#>  Threshold: AUC >= 0.70 is generally considered clinically useful
#>  Assessment: The marker shows clinically relevant predictive ability
#>
#>
#>
#>  Method: This analysis uses Kaplan-Meier (marginal) weighting for
#>  censoring adjustment, appropriate when censoring is independent of
#>  marker values.

9b. Baseline Model Comparison
Compare marker performance against AUC = 0.5 (random). Requires confidence intervals to be enabled for p-value computation.
timeroc(
  data = timeroc_test,
  elapsedtime = "FollowUpMonths",
  outcome = "Recurrence",
  outcomeLevel = "1",
  marker = "Ki67",
  analysisType = "timedep",
  timepoints = "12, 36, 60",
  method = "marginal",
  bootstrapCI = TRUE,
  compareBaseline = TRUE,
  timetypeoutput = "months"
)
#>
#>  TIME-DEPENDENT ROC ANALYSIS
#>
#>  <div style='margin: 10px 0;'><div style='background-color: #eff6ff;
#>  border-left: 4px solid #93c5fd; padding: 12px; margin: 8px 0;
#>  border-radius: 4px;'><strong style='color: #2563eb;'>Analysis Complete
#>  <span style='color: #374151;'>Time-dependent ROC analysis completed.
#>  190 observations, 127 events (66.8%), weighting: marginal.
#>
#>  Time-Dependent ROC Analysis Results
#>
#>  Marker Variable: Ki67
#>
#>  Analysis Method: Cumulative/Dynamic (Kaplan-Meier weighting)
#>
#>  Sample Size: 190 observations, 127 events (66.8%)
#>
#>  Confidence Intervals: Asymptotic (influence function-based)
#>
#>  AUC Interpretation by Timepoint:
#>
#>  At 12 months:
#>
#>  AUC = 0.767 (95% CI: 0.678 - 0.855)
#>
#>  Performance: fair (0.70-0.79) (p = 0.000, significantly better than
#>  chance)
#>
#>  At 36 months:
#>
#>  AUC = 0.765 (95% CI: 0.693 - 0.837)
#>
#>  Performance: fair (0.70-0.79) (p = 0.000, significantly better than
#>  chance)
#>
#>  At 60 months:
#>
#>  AUC = 0.740 (95% CI: 0.660 - 0.819)
#>
#>  Performance: fair (0.70-0.79) (p = 0.000, significantly better than
#>  chance)
#>
#>  Area Under ROC Curve (AUC)
#>  ────────────────────────────────────────────────────────────────────────
#>    Timepoint    AUC          SE            95% CI Lower    95% CI Upper
#>  ────────────────────────────────────────────────────────────────────────
#>           12    0.7670000    0.04500000       0.6780000       0.8550000
#>           36    0.7650000    0.03700000       0.6920000       0.8370000
#>           60    0.7400000    0.04100000       0.6590000       0.8200000
#>  ────────────────────────────────────────────────────────────────────────
#>
#>
#>  Marker Variable Statistics
#>  ──────────────────────────
#>    Statistic     Value
#>  ──────────────────────────
#>    N             190
#>    Mean          31.242
#>    Median        30.45
#>    SD            14.986
#>    IQR           23.475
#>    Min           1
#>    Max           68.5
#>    Events        127
#>    Event Rate    66.8%
#>  ──────────────────────────
#>
#>
#>  Optimal Cutoff Values
#>  ─────────────────────────────────────────────────────────────────────────────
#>    Timepoint    Optimal Cutoff    Sensitivity    Specificity    Youden Index
#>  ─────────────────────────────────────────────────────────────────────────────
#>  ─────────────────────────────────────────────────────────────────────────────
#>
#>
#>  Model Performance Comparison
#>
#>  Comparison to Baseline (AUC = 0.5):
#>
#>  At 12 months:
#>
#>  Improvement: +26.7% (AUC: 0.767 vs 0.50)
#>
#>  p = 0.0000 (significant)
#>
#>  At 36 months:
#>
#>  Improvement: +26.5% (AUC: 0.765 vs 0.50)
#>
#>  p = 0.0000 (significant)
#>
#>  At 60 months:
#>
#>  Improvement: +24.0% (AUC: 0.740 vs 0.50)
#>
#>  p = 0.0000 (significant)
#>
#>  Clinical Interpretation
#>
#>
#>
#>  Overall Performance:
#>
#>  The Ki67 shows fair to good discriminative ability (mean AUC = 0.757).
#>
#>
#>
#>  Time Trend:
#>
#>  Performance shows a declining trend over time.
#>
#>
#>
#>  Clinical Utility:
#>
#>
#>  Best Performance: At 12 months (AUC = 0.767)
#>  Threshold: AUC >= 0.70 is generally considered clinically useful
#>  Assessment: The marker shows clinically relevant predictive ability
#>
#>
#>
#>  Method: This analysis uses Kaplan-Meier (marginal) weighting for
#>  censoring adjustment, appropriate when censoring is independent of
#>  marker values.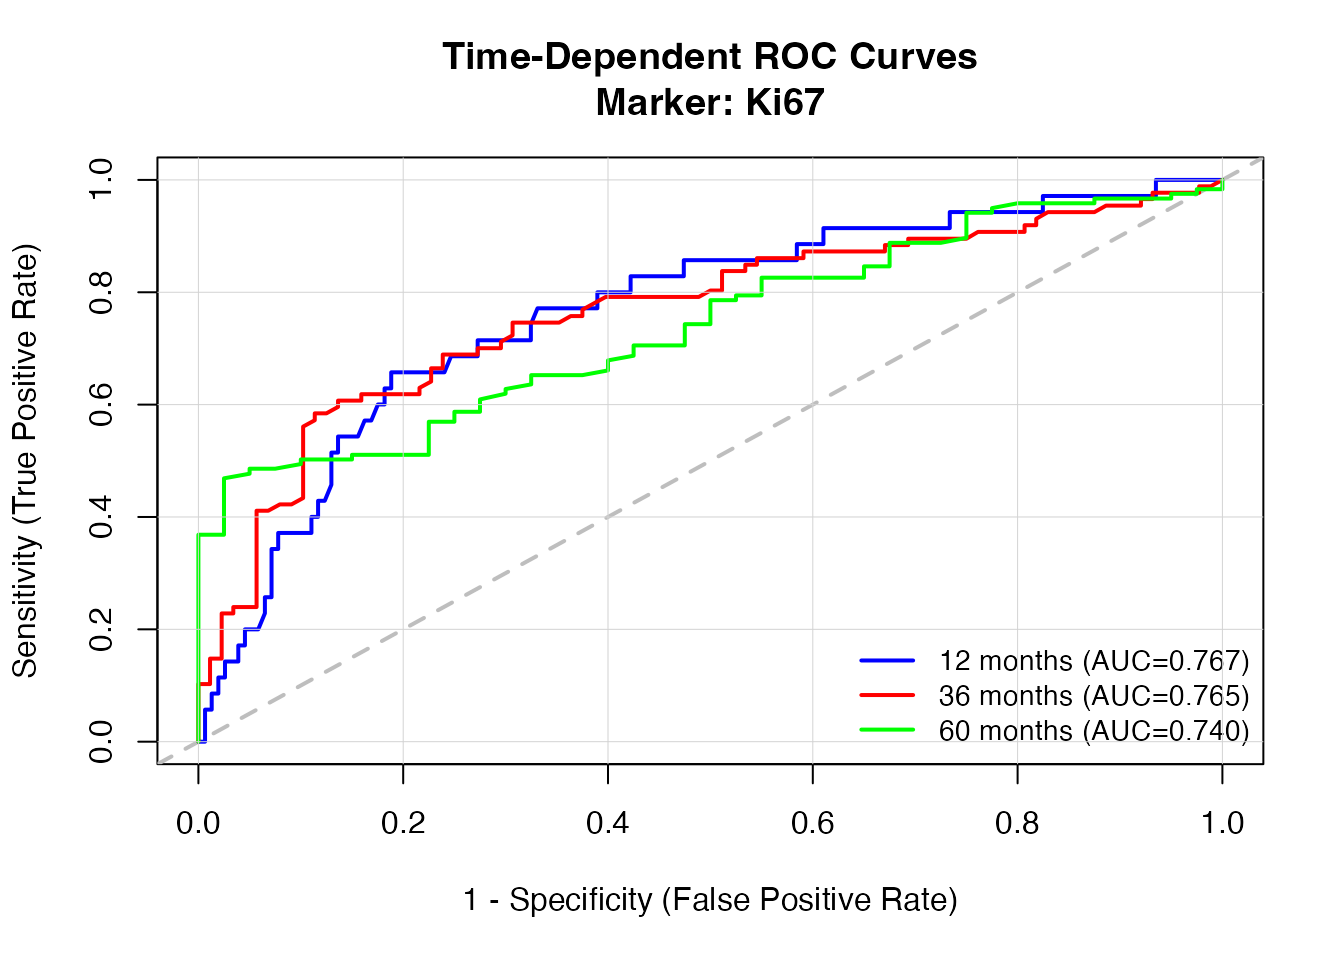
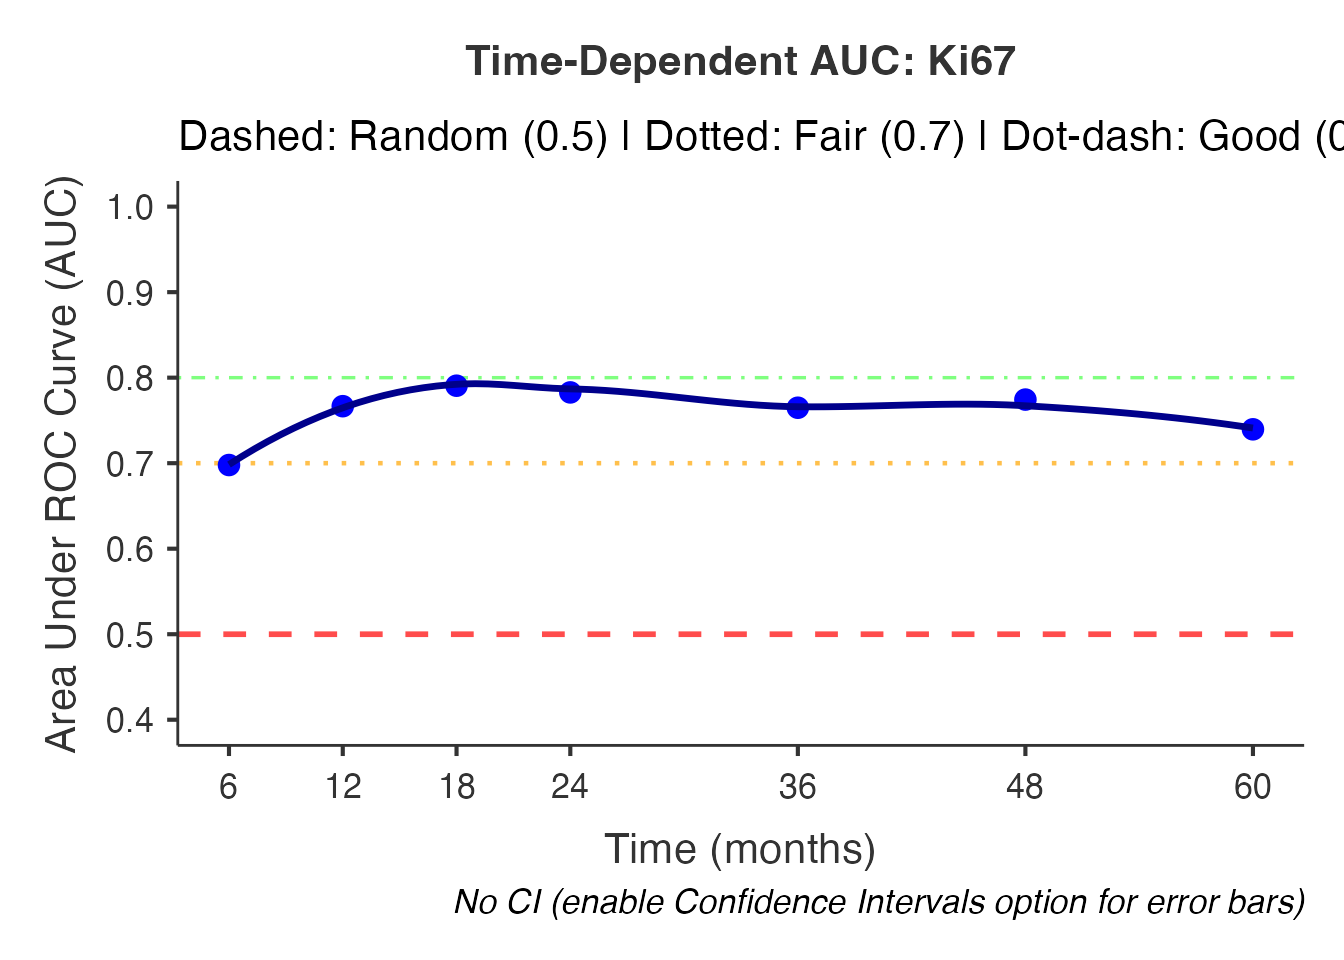
9c. Smooth AUC Curve
Apply loess smoothing to the AUC-over-time plot. Requires more than 2 timepoints to function; otherwise falls back to a straight line.
timeroc(
  data = timeroc_test,
  elapsedtime = "FollowUpMonths",
  outcome = "Recurrence",
  outcomeLevel = "1",
  marker = "Ki67",
  analysisType = "timedep",
  timepoints = "6, 12, 18, 24, 36, 48, 60",
  plotAUC = TRUE,
  smoothAUC = TRUE,
  timetypeoutput = "months"
)
#>
#>  TIME-DEPENDENT ROC ANALYSIS
#>
#>  <div style='margin: 10px 0;'><div style='background-color: #eff6ff;
#>  border-left: 4px solid #93c5fd; padding: 12px; margin: 8px 0;
#>  border-radius: 4px;'><strong style='color: #2563eb;'>Analysis Complete
#>  <span style='color: #374151;'>Time-dependent ROC analysis completed.
#>  190 observations, 127 events (66.8%), weighting: marginal.
#>
#>  Time-Dependent ROC Analysis Results
#>
#>  Marker Variable: Ki67
#>
#>  Analysis Method: Cumulative/Dynamic (Kaplan-Meier weighting)
#>
#>  Sample Size: 190 observations, 127 events (66.8%)
#>
#>  AUC Interpretation by Timepoint:
#>
#>  At 6 months:
#>
#>  AUC = 0.698 (95% CI: NA - NA)
#>
#>  Performance: poor (0.60-0.69) (CI not available: enable Confidence
#>  Intervals option)
#>
#>  At 12 months:
#>
#>  AUC = 0.767 (95% CI: NA - NA)
#>
#>  Performance: fair (0.70-0.79) (CI not available: enable Confidence
#>  Intervals option)
#>
#>  At 18 months:
#>
#>  AUC = 0.791 (95% CI: NA - NA)
#>
#>  Performance: fair (0.70-0.79) (CI not available: enable Confidence
#>  Intervals option)
#>
#>  At 24 months:
#>
#>  AUC = 0.783 (95% CI: NA - NA)
#>
#>  Performance: fair (0.70-0.79) (CI not available: enable Confidence
#>  Intervals option)
#>
#>  At 36 months:
#>
#>  AUC = 0.765 (95% CI: NA - NA)
#>
#>  Performance: fair (0.70-0.79) (CI not available: enable Confidence
#>  Intervals option)
#>
#>  At 48 months:
#>
#>  AUC = 0.774 (95% CI: NA - NA)
#>
#>  Performance: fair (0.70-0.79) (CI not available: enable Confidence
#>  Intervals option)
#>
#>  At 60 months:
#>
#>  AUC = 0.740 (95% CI: NA - NA)
#>
#>  Performance: fair (0.70-0.79) (CI not available: enable Confidence
#>  Intervals option)
#>
#>  Area Under ROC Curve (AUC)
#>  ─────────────────────────────────────────────────────────────────
#>    Timepoint    AUC          SE     95% CI Lower    95% CI Upper
#>  ─────────────────────────────────────────────────────────────────
#>            6    0.6980000    NaN             NaN             NaN
#>           12    0.7670000    NaN             NaN             NaN
#>           18    0.7910000    NaN             NaN             NaN
#>           24    0.7830000    NaN             NaN             NaN
#>           36    0.7650000    NaN             NaN             NaN
#>           48    0.7740000    NaN             NaN             NaN
#>           60    0.7400000    NaN             NaN             NaN
#>  ─────────────────────────────────────────────────────────────────
#>
#>
#>  Marker Variable Statistics
#>  ──────────────────────────
#>    Statistic     Value
#>  ──────────────────────────
#>    N             190
#>    Mean          31.242
#>    Median        30.45
#>    SD            14.986
#>    IQR           23.475
#>    Min           1
#>    Max           68.5
#>    Events        127
#>    Event Rate    66.8%
#>  ──────────────────────────
#>
#>
#>  Optimal Cutoff Values
#>  ─────────────────────────────────────────────────────────────────────────────
#>    Timepoint    Optimal Cutoff    Sensitivity    Specificity    Youden Index
#>  ─────────────────────────────────────────────────────────────────────────────
#>  ─────────────────────────────────────────────────────────────────────────────
#>
#>
#>  Clinical Interpretation
#>
#>
#>
#>  Overall Performance:
#>
#>  The Ki67 shows fair to good discriminative ability (mean AUC = 0.760).
#>
#>
#>
#>  Time Trend:
#>
#>  Performance shows a improving trend over time.
#>
#>
#>
#>  Clinical Utility:
#>
#>
#>  Best Performance: At 18 months (AUC = 0.791)
#>  Threshold: AUC >= 0.70 is generally considered clinically useful
#>  Assessment: The marker shows clinically relevant predictive ability
#>
#>
#>
#>  Method: This analysis uses Kaplan-Meier (marginal) weighting for
#>  censoring adjustment, appropriate when censoring is independent of
#>  marker values.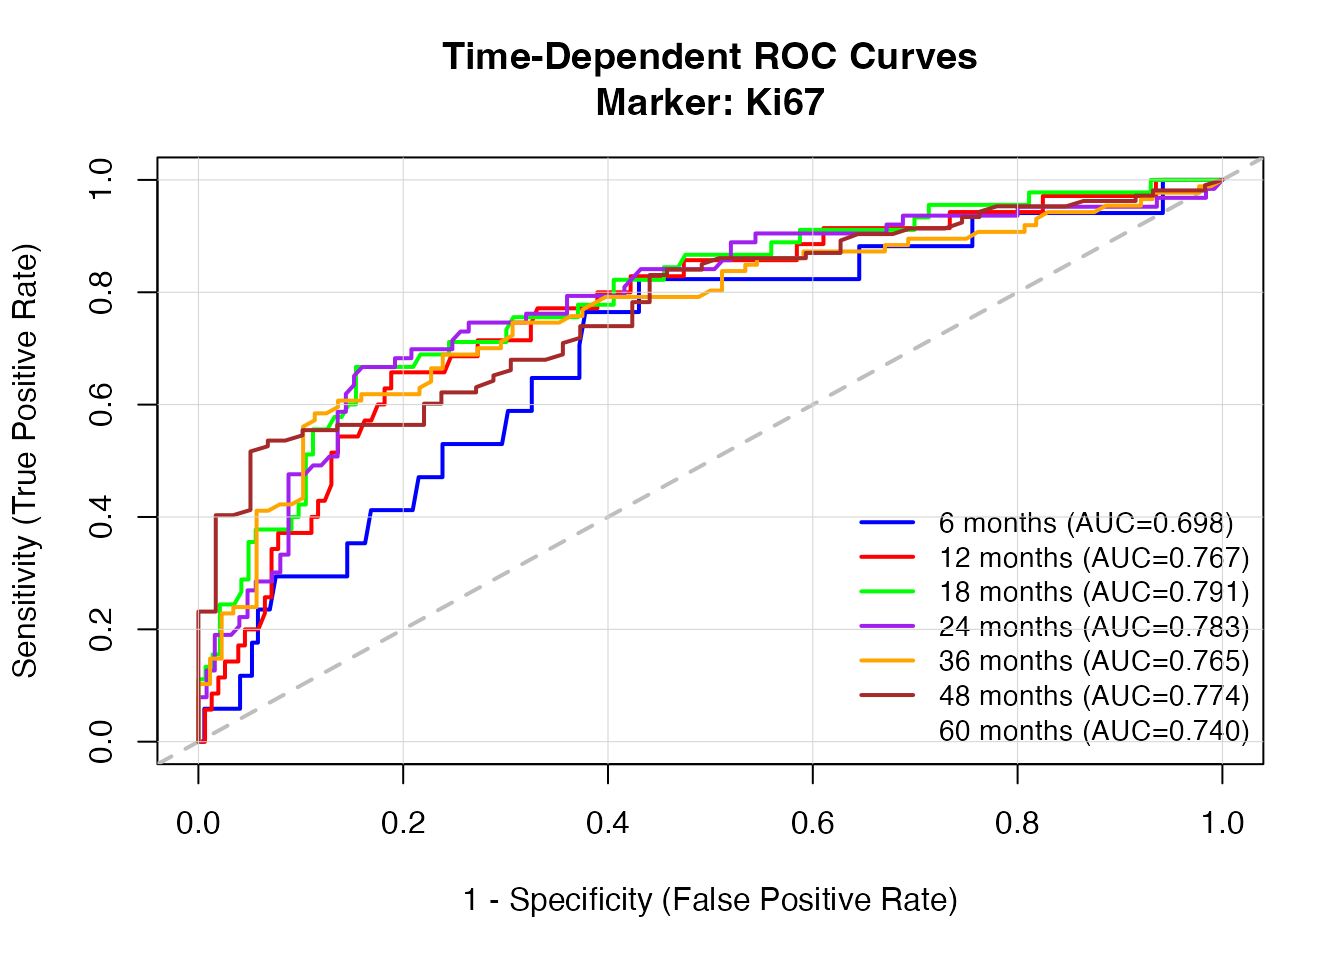
9d. Time Unit Labels
Change the time unit for display in plots and interpretation text. Does not transform the numeric values.
timeroc(
  data = timeroc_test,
  elapsedtime = "FollowUpMonths",
  outcome = "Recurrence",
  outcomeLevel = "1",
  marker = "Ki67",
  analysisType = "timedep",
  timepoints = "12, 36, 60",
  timetypeoutput = "years"
)
#>
#>  TIME-DEPENDENT ROC ANALYSIS
#>
#>  <div style='margin: 10px 0;'><div style='background-color: #eff6ff;
#>  border-left: 4px solid #93c5fd; padding: 12px; margin: 8px 0;
#>  border-radius: 4px;'><strong style='color: #2563eb;'>Analysis Complete
#>  <span style='color: #374151;'>Time-dependent ROC analysis completed.
#>  190 observations, 127 events (66.8%), weighting: marginal.
#>
#>  Time-Dependent ROC Analysis Results
#>
#>  Marker Variable: Ki67
#>
#>  Analysis Method: Cumulative/Dynamic (Kaplan-Meier weighting)
#>
#>  Sample Size: 190 observations, 127 events (66.8%)
#>
#>  AUC Interpretation by Timepoint:
#>
#>  At 12 years:
#>
#>  AUC = 0.767 (95% CI: NA - NA)
#>
#>  Performance: fair (0.70-0.79) (CI not available: enable Confidence
#>  Intervals option)
#>
#>  At 36 years:
#>
#>  AUC = 0.765 (95% CI: NA - NA)
#>
#>  Performance: fair (0.70-0.79) (CI not available: enable Confidence
#>  Intervals option)
#>
#>  At 60 years:
#>
#>  AUC = 0.740 (95% CI: NA - NA)
#>
#>  Performance: fair (0.70-0.79) (CI not available: enable Confidence
#>  Intervals option)
#>
#>  Area Under ROC Curve (AUC)
#>  ─────────────────────────────────────────────────────────────────
#>    Timepoint    AUC          SE     95% CI Lower    95% CI Upper
#>  ─────────────────────────────────────────────────────────────────
#>           12    0.7670000    NaN             NaN             NaN
#>           36    0.7650000    NaN             NaN             NaN
#>           60    0.7400000    NaN             NaN             NaN
#>  ─────────────────────────────────────────────────────────────────
#>
#>
#>  Marker Variable Statistics
#>  ──────────────────────────
#>    Statistic     Value
#>  ──────────────────────────
#>    N             190
#>    Mean          31.242
#>    Median        30.45
#>    SD            14.986
#>    IQR           23.475
#>    Min           1
#>    Max           68.5
#>    Events        127
#>    Event Rate    66.8%
#>  ──────────────────────────
#>
#>
#>  Optimal Cutoff Values
#>  ─────────────────────────────────────────────────────────────────────────────
#>    Timepoint    Optimal Cutoff    Sensitivity    Specificity    Youden Index
#>  ─────────────────────────────────────────────────────────────────────────────
#>  ─────────────────────────────────────────────────────────────────────────────
#>
#>
#>  Clinical Interpretation
#>
#>
#>
#>  Overall Performance:
#>
#>  The Ki67 shows fair to good discriminative ability (mean AUC = 0.757).
#>
#>
#>
#>  Time Trend:
#>
#>  Performance shows a declining trend over time.
#>
#>
#>
#>  Clinical Utility:
#>
#>
#>  Best Performance: At 12 years (AUC = 0.767)
#>  Threshold: AUC >= 0.70 is generally considered clinically useful
#>  Assessment: The marker shows clinically relevant predictive ability
#>
#>
#>
#>  Method: This analysis uses Kaplan-Meier (marginal) weighting for
#>  censoring adjustment, appropriate when censoring is independent of
#>  marker values.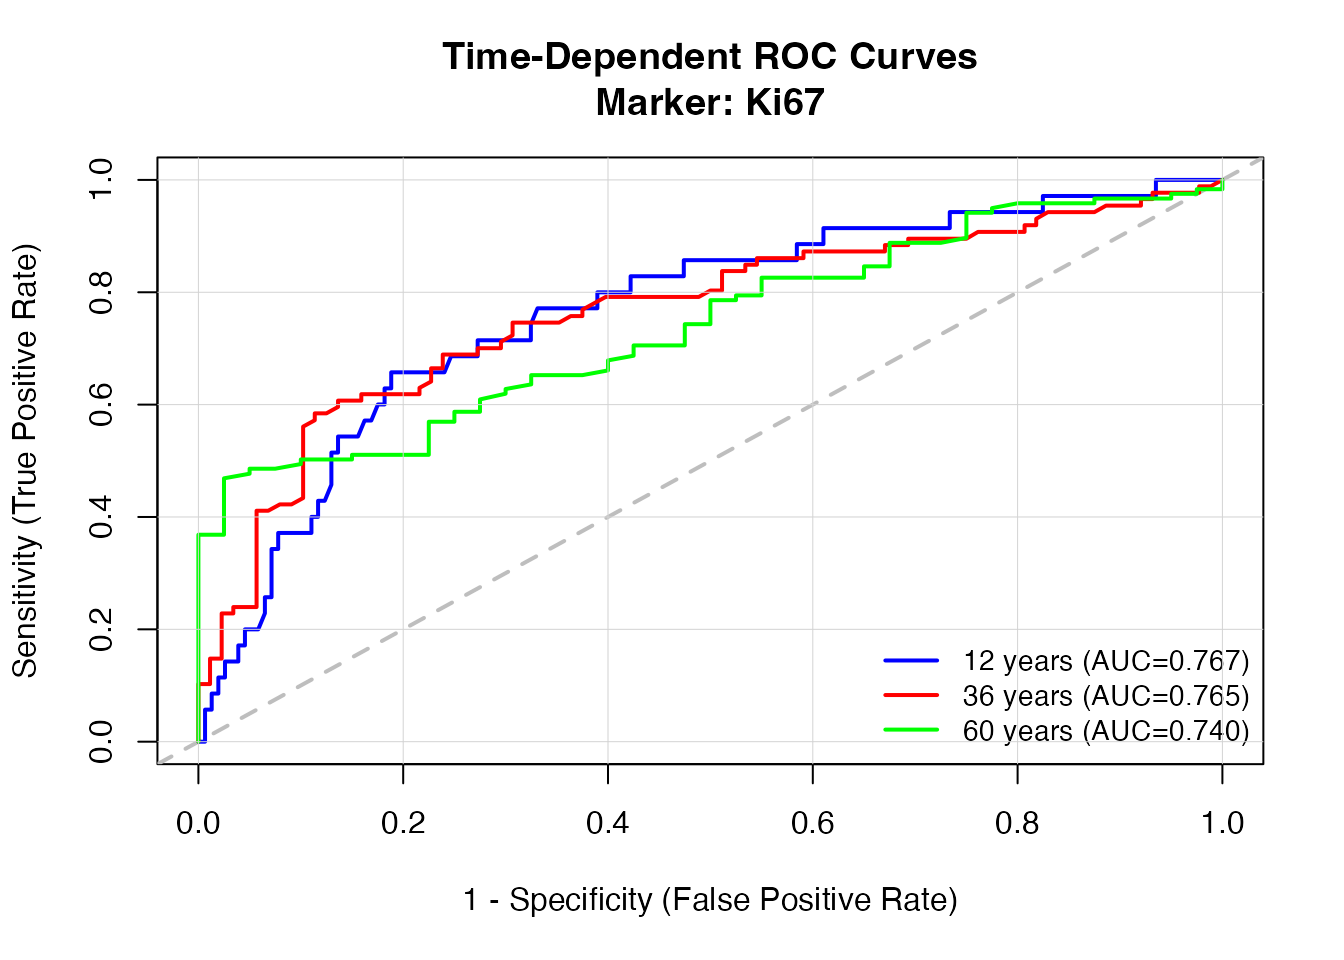
9e. Suppress Plots
Turn off ROC curve plot and/or AUC-over-time plot for table-only output.
timeroc(
  data = timeroc_test,
  elapsedtime = "FollowUpMonths",
  outcome = "Recurrence",
  outcomeLevel = "1",
  marker = "Ki67",
  analysisType = "timedep",
  timepoints = "12, 36, 60",
  plotROC = FALSE,
  plotAUC = FALSE,
  timetypeoutput = "months"
)
#>
#>  TIME-DEPENDENT ROC ANALYSIS
#>
#>  <div style='margin: 10px 0;'><div style='background-color: #eff6ff;
#>  border-left: 4px solid #93c5fd; padding: 12px; margin: 8px 0;
#>  border-radius: 4px;'><strong style='color: #2563eb;'>Analysis Complete
#>  <span style='color: #374151;'>Time-dependent ROC analysis completed.
#>  190 observations, 127 events (66.8%), weighting: marginal.
#>
#>  Time-Dependent ROC Analysis Results
#>
#>  Marker Variable: Ki67
#>
#>  Analysis Method: Cumulative/Dynamic (Kaplan-Meier weighting)
#>
#>  Sample Size: 190 observations, 127 events (66.8%)
#>
#>  AUC Interpretation by Timepoint:
#>
#>  At 12 months:
#>
#>  AUC = 0.767 (95% CI: NA - NA)
#>
#>  Performance: fair (0.70-0.79) (CI not available: enable Confidence
#>  Intervals option)
#>
#>  At 36 months:
#>
#>  AUC = 0.765 (95% CI: NA - NA)
#>
#>  Performance: fair (0.70-0.79) (CI not available: enable Confidence
#>  Intervals option)
#>
#>  At 60 months:
#>
#>  AUC = 0.740 (95% CI: NA - NA)
#>
#>  Performance: fair (0.70-0.79) (CI not available: enable Confidence
#>  Intervals option)
#>
#>  Area Under ROC Curve (AUC)
#>  ─────────────────────────────────────────────────────────────────
#>    Timepoint    AUC          SE     95% CI Lower    95% CI Upper
#>  ─────────────────────────────────────────────────────────────────
#>           12    0.7670000    NaN             NaN             NaN
#>           36    0.7650000    NaN             NaN             NaN
#>           60    0.7400000    NaN             NaN             NaN
#>  ─────────────────────────────────────────────────────────────────
#>
#>
#>  Marker Variable Statistics
#>  ──────────────────────────
#>    Statistic     Value
#>  ──────────────────────────
#>    N             190
#>    Mean          31.242
#>    Median        30.45
#>    SD            14.986
#>    IQR           23.475
#>    Min           1
#>    Max           68.5
#>    Events        127
#>    Event Rate    66.8%
#>  ──────────────────────────
#>
#>
#>  Optimal Cutoff Values
#>  ─────────────────────────────────────────────────────────────────────────────
#>    Timepoint    Optimal Cutoff    Sensitivity    Specificity    Youden Index
#>  ─────────────────────────────────────────────────────────────────────────────
#>  ─────────────────────────────────────────────────────────────────────────────
#>
#>
#>  Clinical Interpretation
#>
#>
#>
#>  Overall Performance:
#>
#>  The Ki67 shows fair to good discriminative ability (mean AUC = 0.757).
#>
#>
#>
#>  Time Trend:
#>
#>  Performance shows a declining trend over time.
#>
#>
#>
#>  Clinical Utility:
#>
#>
#>  Best Performance: At 12 months (AUC = 0.767)
#>  Threshold: AUC >= 0.70 is generally considered clinically useful
#>  Assessment: The marker shows clinically relevant predictive ability
#>
#>
#>
#>  Method: This analysis uses Kaplan-Meier (marginal) weighting for
#>  censoring adjustment, appropriate when censoring is independent of
#>  marker values.
10. Edge Cases
10a. Timepoints Beyond Follow-Up
When all specified timepoints exceed the maximum follow-up time, the function automatically substitutes quartiles of observed follow-up.
timeroc(
  data = timeroc_test,
  elapsedtime = "FollowUpMonths",
  outcome = "Recurrence",
  outcomeLevel = "1",
  marker = "Ki67",
  analysisType = "timedep",
  timepoints = "120, 240, 360",
  timetypeoutput = "months"
)
#>
#>  TIME-DEPENDENT ROC ANALYSIS
#>
#>  <div style='margin: 10px 0;'><div style='background-color: #fefce8;
#>  border-left: 4px solid #fde047; padding: 12px; margin: 8px 0;
#>  border-radius: 4px;'><strong style='color: #ca8a04;'>Timepoints
#>  Adjusted
#>  <span style='color: #374151;'>All specified timepoints exceed maximum
#>  follow-up (112.5). Using quartiles of follow-up time instead.<div
#>  style='background-color: #fef2f2; border-left: 4px solid #fca5a5;
#>  padding: 12px; margin: 8px 0; border-radius: 4px;'><strong
#>  style='color: #dc2626;'>Analysis Failed
#>  <span style='color: #374151;'>invalid format '%d'; use format %f, %e,
#>  %g or %a for numeric objects
#>
#>  Time-Dependent ROC Analysis Error
#>
#>  Error: invalid format '%d'; use format %f, %e, %g or %a for numeric
#>  objects
#>
#>
#>
#>  Common Issues:
#>
#>
#>  Time Variable: Must be positive numeric
#>  Outcome: Must be binary (0/1) or factor with event level
#>  Marker: Must be continuous with sufficient variation
#>  Events: Need at least 5-10 events for reliable analysis
#>  Timepoints: Should be within follow-up period
#>
#>
#>
#>  Data Summary:
#>
#>
#>  N: 190, Events: 127 (66.8%)
#>  Follow-up: 0.5 to 112.5 months
#>  Timepoints: 18.9, 33.05, 55.3
#>
#>
#>
#>  Area Under ROC Curve (AUC)
#>  ─────────────────────────────────────────────────────────────────
#>    Timepoint    AUC          SE     95% CI Lower    95% CI Upper
#>  ─────────────────────────────────────────────────────────────────
#>           19    0.7950000    NaN             NaN             NaN
#>           33    0.7670000    NaN             NaN             NaN
#>           55    0.7650000    NaN             NaN             NaN
#>  ─────────────────────────────────────────────────────────────────
#>
#>
#>  Marker Variable Statistics
#>  ──────────────────────────
#>    Statistic     Value
#>  ──────────────────────────
#>    N             190
#>    Mean          31.242
#>    Median        30.45
#>    SD            14.986
#>    IQR           23.475
#>    Min           1
#>    Max           68.5
#>    Events        127
#>    Event Rate    66.8%
#>  ──────────────────────────
#>
#>
#>  Optimal Cutoff Values
#>  ─────────────────────────────────────────────────────────────────────────────
#>    Timepoint    Optimal Cutoff    Sensitivity    Specificity    Youden Index
#>  ─────────────────────────────────────────────────────────────────────────────
#>  ─────────────────────────────────────────────────────────────────────────────
#>
#>
#> character(0)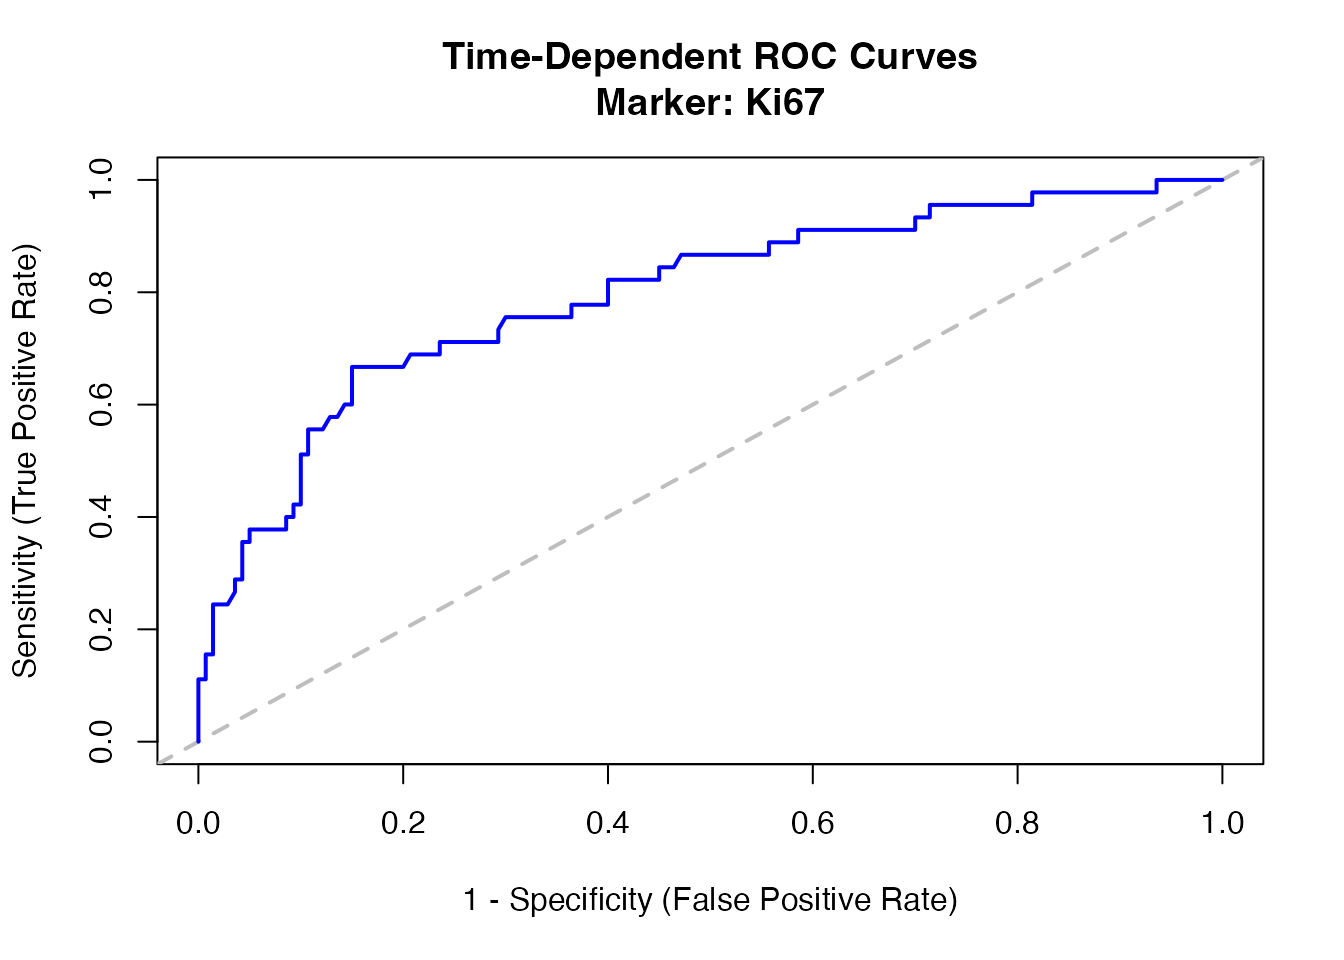
#> Error in `sprintf()`:
#> ! invalid format '%d'; use format %f, %e, %g or %a for numeric objects
10b. Invalid Timepoints String
Non-parseable timepoint strings fall back to the defaults (12, 36, 60).
timeroc(
  data = timeroc_test,
  elapsedtime = "FollowUpMonths",
  outcome = "Recurrence",
  outcomeLevel = "1",
  marker = "Ki67",
  analysisType = "timedep",
  timepoints = "abc, xyz",
  timetypeoutput = "months"
)
#>
#>  TIME-DEPENDENT ROC ANALYSIS
#>
#>  <div style='margin: 10px 0;'><div style='background-color: #eff6ff;
#>  border-left: 4px solid #93c5fd; padding: 12px; margin: 8px 0;
#>  border-radius: 4px;'><strong style='color: #2563eb;'>Analysis Complete
#>  <span style='color: #374151;'>Time-dependent ROC analysis completed.
#>  190 observations, 127 events (66.8%), weighting: marginal.
#>
#>  Time-Dependent ROC Analysis Results
#>
#>  Marker Variable: Ki67
#>
#>  Analysis Method: Cumulative/Dynamic (Kaplan-Meier weighting)
#>
#>  Sample Size: 190 observations, 127 events (66.8%)
#>
#>  AUC Interpretation by Timepoint:
#>
#>  At 12 months:
#>
#>  AUC = 0.767 (95% CI: NA - NA)
#>
#>  Performance: fair (0.70-0.79) (CI not available: enable Confidence
#>  Intervals option)
#>
#>  At 36 months:
#>
#>  AUC = 0.765 (95% CI: NA - NA)
#>
#>  Performance: fair (0.70-0.79) (CI not available: enable Confidence
#>  Intervals option)
#>
#>  At 60 months:
#>
#>  AUC = 0.740 (95% CI: NA - NA)
#>
#>  Performance: fair (0.70-0.79) (CI not available: enable Confidence
#>  Intervals option)
#>
#>  Area Under ROC Curve (AUC)
#>  ─────────────────────────────────────────────────────────────────
#>    Timepoint    AUC          SE     95% CI Lower    95% CI Upper
#>  ─────────────────────────────────────────────────────────────────
#>           12    0.7670000    NaN             NaN             NaN
#>           36    0.7650000    NaN             NaN             NaN
#>           60    0.7400000    NaN             NaN             NaN
#>  ─────────────────────────────────────────────────────────────────
#>
#>
#>  Marker Variable Statistics
#>  ──────────────────────────
#>    Statistic     Value
#>  ──────────────────────────
#>    N             190
#>    Mean          31.242
#>    Median        30.45
#>    SD            14.986
#>    IQR           23.475
#>    Min           1
#>    Max           68.5
#>    Events        127
#>    Event Rate    66.8%
#>  ──────────────────────────
#>
#>
#>  Optimal Cutoff Values
#>  ─────────────────────────────────────────────────────────────────────────────
#>    Timepoint    Optimal Cutoff    Sensitivity    Specificity    Youden Index
#>  ─────────────────────────────────────────────────────────────────────────────
#>  ─────────────────────────────────────────────────────────────────────────────
#>
#>
#>  Clinical Interpretation
#>
#>
#>
#>  Overall Performance:
#>
#>  The Ki67 shows fair to good discriminative ability (mean AUC = 0.757).
#>
#>
#>
#>  Time Trend:
#>
#>  Performance shows a declining trend over time.
#>
#>
#>
#>  Clinical Utility:
#>
#>
#>  Best Performance: At 12 months (AUC = 0.767)
#>  Threshold: AUC >= 0.70 is generally considered clinically useful
#>  Assessment: The marker shows clinically relevant predictive ability
#>
#>
#>
#>  Method: This analysis uses Kaplan-Meier (marginal) weighting for
#>  censoring adjustment, appropriate when censoring is independent of
#>  marker values.

10c. Noise Marker (AUC Near 0.5)
A random noise marker should produce AUC close to 0.5, triggering a “Limited Clinical Utility” warning.
timeroc(
  data = timeroc_test,
  outcome = "Recurrence",
  outcomeLevel = "1",
  marker = "NoiseMarker",
  analysisType = "binary",
  youdenIndex = TRUE
)
#>
#>  TIME-DEPENDENT ROC ANALYSIS
#>
#>  <div style='margin: 10px 0;'><div style='background-color: #fefce8;
#>  border-left: 4px solid #fde047; padding: 12px; margin: 8px 0;
#>  border-radius: 4px;'><strong style='color: #ca8a04;'>Limited Clinical
#>  Utility
#>  <span style='color: #374151;'>AUC = 0.546 is below 0.70. The marker
#>  shows limited discriminative ability for clinical decision-making.<div
#>  style='background-color: #eff6ff; border-left: 4px solid #93c5fd;
#>  padding: 12px; margin: 8px 0; border-radius: 4px;'><strong
#>  style='color: #2563eb;'>Analysis Complete
#>  <span style='color: #374151;'>Binary ROC analysis completed. 200
#>  observations, 132 events (66.0% event rate).
#>
#> character(0)
#>
#>  Binary ROC Analysis Results
#>  ──────────────────────────────────────────────────────────────────────────────────────────────────────────────────────────
#>    Marker         AUC          SE            95% CI Lower    95% CI Upper    Sensitivity    Specificity    Optimal Cutoff
#>  ──────────────────────────────────────────────────────────────────────────────────────────────────────────────────────────
#>    NoiseMarker    0.5460000    0.04300000       0.4600000       0.6310000      0.9240000      0.1620000          67.50000
#>  ──────────────────────────────────────────────────────────────────────────────────────────────────────────────────────────
#>
#>
#>  Diagnostic Performance Summary
#>
#>  AUC: 0.546 (No discrimination (equivalent to random chance))
#>
#>  95% CI: [0.46, 0.631]
#>
#>
#>
#>  Clinical Interpretation:
#>
#>
#>  An AUC of 0.546 indicates correct discrimination in 54.6% of randomly
#>  selected case-control pairs.
#>  The 95% CI suggests the true AUC lies between 0.46 and 0.631.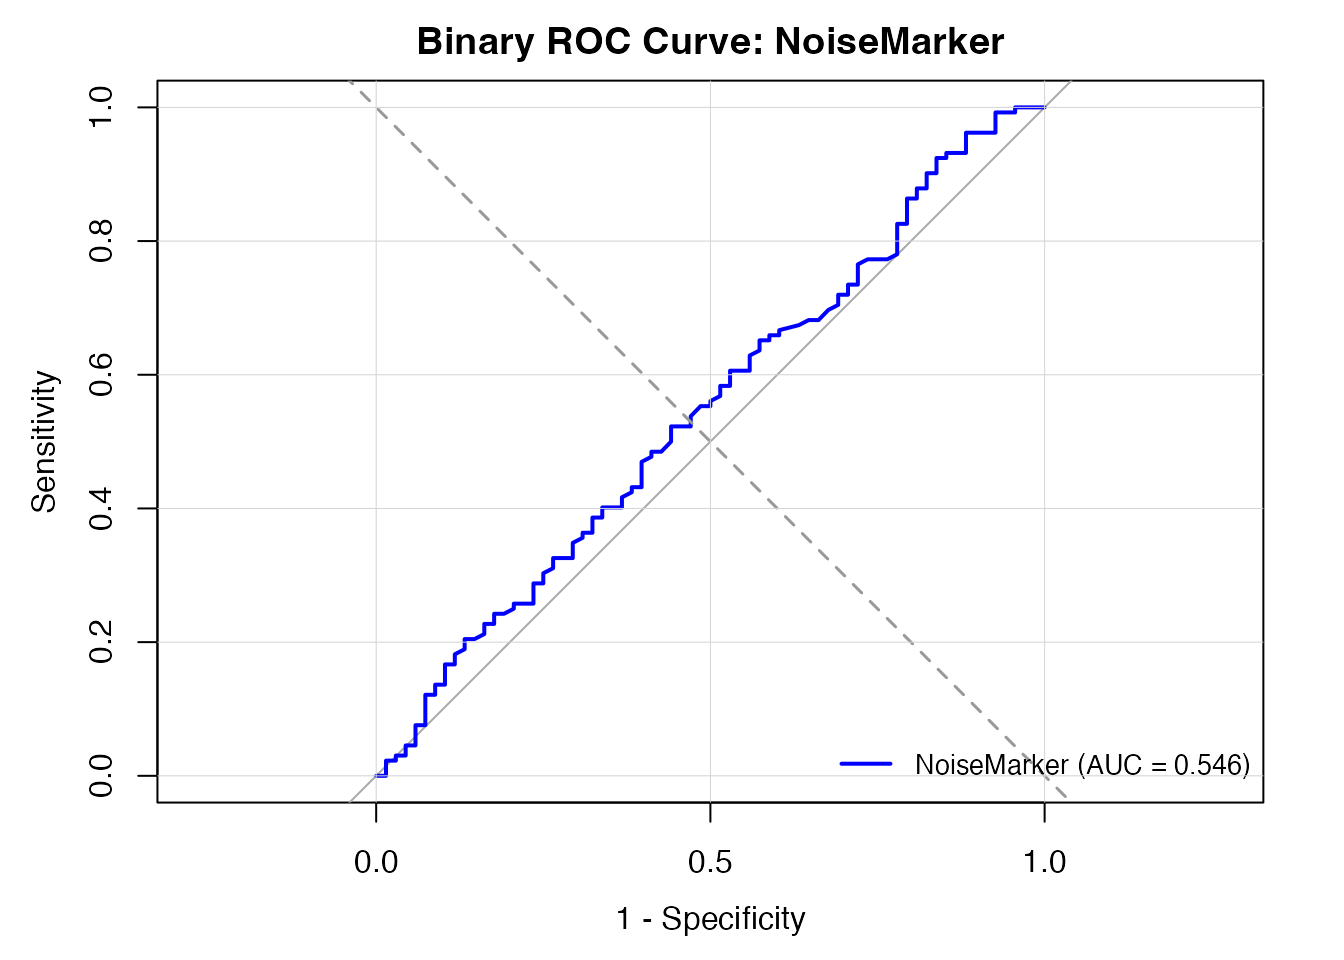
10d. Single Timepoint
Analysis with only one evaluation timepoint.
timeroc(
  data = timeroc_test,
  elapsedtime = "FollowUpMonths",
  outcome = "Recurrence",
  outcomeLevel = "1",
  marker = "Ki67",
  analysisType = "timedep",
  timepoints = "24",
  timetypeoutput = "months"
)
#>
#>  TIME-DEPENDENT ROC ANALYSIS
#>
#>  <div style='margin: 10px 0;'><div style='background-color: #fef2f2;
#>  border-left: 4px solid #fca5a5; padding: 12px; margin: 8px 0;
#>  border-radius: 4px;'><strong style='color: #dc2626;'>Analysis Failed
#>  <span style='color: #374151;'>missing value where TRUE/FALSE needed
#>
#>  Time-Dependent ROC Analysis Error
#>
#>  Error: missing value where TRUE/FALSE needed
#>
#>
#>
#>  Common Issues:
#>
#>
#>  Time Variable: Must be positive numeric
#>  Outcome: Must be binary (0/1) or factor with event level
#>  Marker: Must be continuous with sufficient variation
#>  Events: Need at least 5-10 events for reliable analysis
#>  Timepoints: Should be within follow-up period
#>
#>
#>
#>  Data Summary:
#>
#>
#>  N: 190, Events: 127 (66.8%)
#>  Follow-up: 0.5 to 112.5 months
#>  Timepoints: 24
#>
#>
#>
#>  Area Under ROC Curve (AUC)
#>  ─────────────────────────────────────────────────────────────────
#>    Timepoint    AUC          SE     95% CI Lower    95% CI Upper
#>  ─────────────────────────────────────────────────────────────────
#>           24    0.7830000    NaN             NaN             NaN
#>  ─────────────────────────────────────────────────────────────────
#>
#>
#>  Marker Variable Statistics
#>  ──────────────────────────
#>    Statistic     Value
#>  ──────────────────────────
#>    N             190
#>    Mean          31.242
#>    Median        30.45
#>    SD            14.986
#>    IQR           23.475
#>    Min           1
#>    Max           68.5
#>    Events        127
#>    Event Rate    66.8%
#>  ──────────────────────────
#>
#>
#>  Optimal Cutoff Values
#>  ─────────────────────────────────────────────────────────────────────────────
#>    Timepoint    Optimal Cutoff    Sensitivity    Specificity    Youden Index
#>  ─────────────────────────────────────────────────────────────────────────────
#>  ─────────────────────────────────────────────────────────────────────────────
#>
#>
#> character(0)
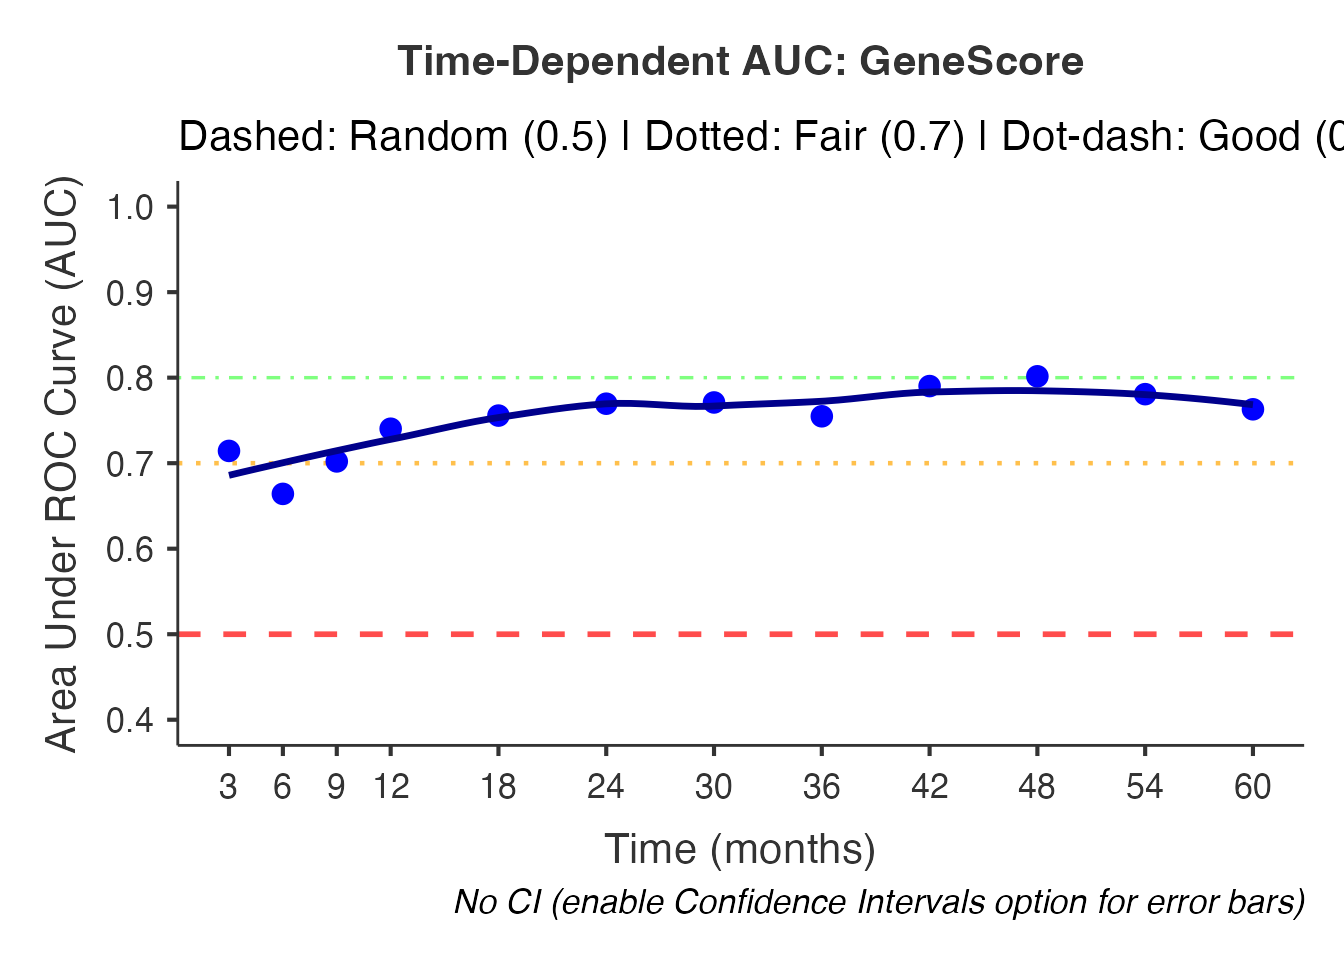
10e. Many Timepoints with Smoothing
Dense timepoints with loess smoothing for a smooth AUC trajectory.
timeroc(
  data = timeroc_test,
  elapsedtime = "FollowUpMonths",
  outcome = "Recurrence",
  outcomeLevel = "1",
  marker = "GeneScore",
  analysisType = "timedep",
  timepoints = "3, 6, 9, 12, 18, 24, 30, 36, 42, 48, 54, 60",
  smoothAUC = TRUE,
  plotAUC = TRUE,
  timetypeoutput = "months"
)
#>
#>  TIME-DEPENDENT ROC ANALYSIS
#>
#>  <div style='margin: 10px 0;'><div style='background-color: #eff6ff;
#>  border-left: 4px solid #93c5fd; padding: 12px; margin: 8px 0;
#>  border-radius: 4px;'><strong style='color: #2563eb;'>Analysis Complete
#>  <span style='color: #374151;'>Time-dependent ROC analysis completed.
#>  194 observations, 126 events (64.9%), weighting: marginal.
#>
#>  Time-Dependent ROC Analysis Results
#>
#>  Marker Variable: GeneScore
#>
#>  Analysis Method: Cumulative/Dynamic (Kaplan-Meier weighting)
#>
#>  Sample Size: 194 observations, 126 events (64.9%)
#>
#>  AUC Interpretation by Timepoint:
#>
#>  At 3 months:
#>
#>  AUC = 0.714 (95% CI: NA - NA)
#>
#>  Performance: fair (0.70-0.79) (CI not available: enable Confidence
#>  Intervals option)
#>
#>  At 6 months:
#>
#>  AUC = 0.664 (95% CI: NA - NA)
#>
#>  Performance: poor (0.60-0.69) (CI not available: enable Confidence
#>  Intervals option)
#>
#>  At 9 months:
#>
#>  AUC = 0.702 (95% CI: NA - NA)
#>
#>  Performance: fair (0.70-0.79) (CI not available: enable Confidence
#>  Intervals option)
#>
#>  At 12 months:
#>
#>  AUC = 0.740 (95% CI: NA - NA)
#>
#>  Performance: fair (0.70-0.79) (CI not available: enable Confidence
#>  Intervals option)
#>
#>  At 18 months:
#>
#>  AUC = 0.756 (95% CI: NA - NA)
#>
#>  Performance: fair (0.70-0.79) (CI not available: enable Confidence
#>  Intervals option)
#>
#>  At 24 months:
#>
#>  AUC = 0.770 (95% CI: NA - NA)
#>
#>  Performance: fair (0.70-0.79) (CI not available: enable Confidence
#>  Intervals option)
#>
#>  At 30 months:
#>
#>  AUC = 0.771 (95% CI: NA - NA)
#>
#>  Performance: fair (0.70-0.79) (CI not available: enable Confidence
#>  Intervals option)
#>
#>  At 36 months:
#>
#>  AUC = 0.755 (95% CI: NA - NA)
#>
#>  Performance: fair (0.70-0.79) (CI not available: enable Confidence
#>  Intervals option)
#>
#>  At 42 months:
#>
#>  AUC = 0.790 (95% CI: NA - NA)
#>
#>  Performance: fair (0.70-0.79) (CI not available: enable Confidence
#>  Intervals option)
#>
#>  At 48 months:
#>
#>  AUC = 0.802 (95% CI: NA - NA)
#>
#>  Performance: good (0.80-0.89) (CI not available: enable Confidence
#>  Intervals option)
#>
#>  At 54 months:
#>
#>  AUC = 0.781 (95% CI: NA - NA)
#>
#>  Performance: fair (0.70-0.79) (CI not available: enable Confidence
#>  Intervals option)
#>
#>  At 60 months:
#>
#>  AUC = 0.763 (95% CI: NA - NA)
#>
#>  Performance: fair (0.70-0.79) (CI not available: enable Confidence
#>  Intervals option)
#>
#>  Area Under ROC Curve (AUC)
#>  ─────────────────────────────────────────────────────────────────
#>    Timepoint    AUC          SE     95% CI Lower    95% CI Upper
#>  ─────────────────────────────────────────────────────────────────
#>            3    0.7140000    NaN             NaN             NaN
#>            6    0.6640000    NaN             NaN             NaN
#>            9    0.7020000    NaN             NaN             NaN
#>           12    0.7400000    NaN             NaN             NaN
#>           18    0.7560000    NaN             NaN             NaN
#>           24    0.7700000    NaN             NaN             NaN
#>           30    0.7710000    NaN             NaN             NaN
#>           36    0.7550000    NaN             NaN             NaN
#>           42    0.7900000    NaN             NaN             NaN
#>           48    0.8020000    NaN             NaN             NaN
#>           54    0.7810000    NaN             NaN             NaN
#>           60    0.7630000    NaN             NaN             NaN
#>  ─────────────────────────────────────────────────────────────────
#>
#>
#>  Marker Variable Statistics
#>  ──────────────────────────
#>    Statistic     Value
#>  ──────────────────────────
#>    N             194
#>    Mean          4.833
#>    Median        4.815
#>    SD            1.947
#>    IQR           2.367
#>    Min           0
#>    Max           9.57
#>    Events        126
#>    Event Rate    64.9%
#>  ──────────────────────────
#>
#>
#>  Optimal Cutoff Values
#>  ─────────────────────────────────────────────────────────────────────────────
#>    Timepoint    Optimal Cutoff    Sensitivity    Specificity    Youden Index
#>  ─────────────────────────────────────────────────────────────────────────────
#>  ─────────────────────────────────────────────────────────────────────────────
#>
#>
#>  Clinical Interpretation
#>
#>
#>
#>  Overall Performance:
#>
#>  The GeneScore shows fair to good discriminative ability (mean AUC =
#>  0.751).
#>
#>
#>
#>  Time Trend:
#>
#>  Performance shows a improving trend over time.
#>
#>
#>
#>  Clinical Utility:
#>
#>
#>  Best Performance: At 48 months (AUC = 0.802)
#>  Threshold: AUC >= 0.70 is generally considered clinically useful
#>  Assessment: The marker shows clinically relevant predictive ability
#>
#>
#>
#>  Method: This analysis uses Kaplan-Meier (marginal) weighting for
#>  censoring adjustment, appropriate when censoring is independent of
#>  marker values.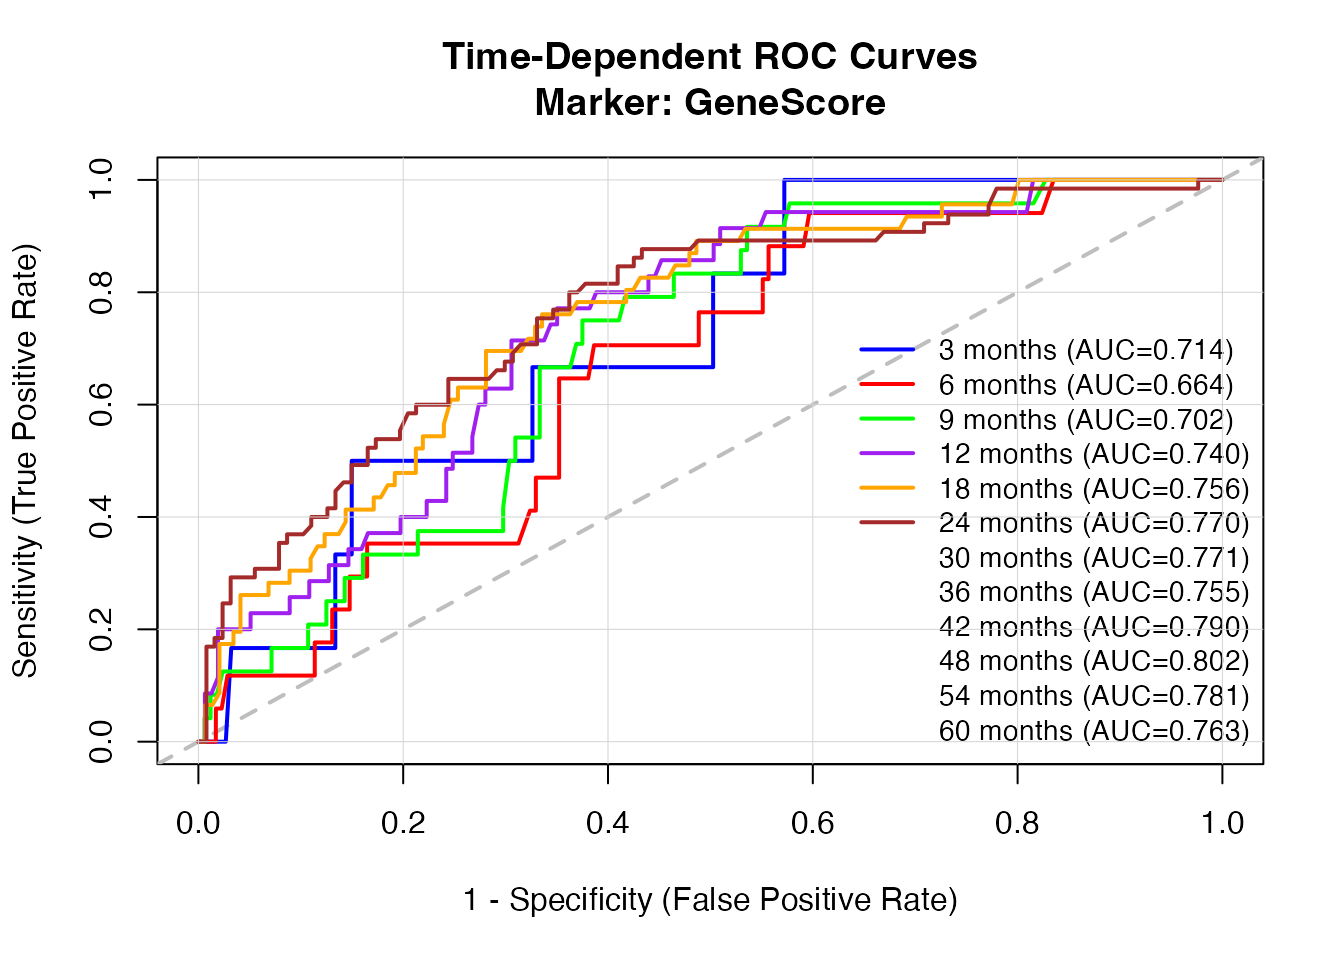
11. Clinical Interpretation
The module provides automated clinical interpretation at multiple levels:
Time-Dependent Mode
- Per-timepoint interpretation: AUC classification (excellent/good/fair/poor/failed) with significance testing against AUC = 0.5 (when CI enabled)
- Overall assessment: Mean AUC, performance trend (improving/declining/stable), best-performing timepoint
- Method context: Explanation of the IPCW weighting method used
- Notices: Severity-graded feedback (ERROR, STRONG_WARNING, WARNING, INFO) for data quality issues, reversed markers, and limited clinical utility
Binary Mode
- AUC classification: Excellent (>=0.9), Good (0.8-0.9), Fair (0.7-0.8), Poor (0.6-0.7), No discrimination (<0.6)
- Diagnostic performance summary: AUC with 95% CI, interpretation of discriminative ability
- Optimal threshold: Youden index-based cutoff with sensitivity and specificity
timeroc(
  data = timeroc_test,
  elapsedtime = "FollowUpMonths",
  outcome = "Recurrence",
  outcomeLevel = "1",
  marker = "GeneScore",
  analysisType = "timedep",
  timepoints = "12, 36, 60",
  method = "marginal",
  bootstrapCI = TRUE,
  showOptimalCutoff = TRUE,
  showMarkerStats = TRUE,
  compareBaseline = TRUE,
  timetypeoutput = "months"
)
#>
#>  TIME-DEPENDENT ROC ANALYSIS
#>
#>  <div style='margin: 10px 0;'><div style='background-color: #eff6ff;
#>  border-left: 4px solid #93c5fd; padding: 12px; margin: 8px 0;
#>  border-radius: 4px;'><strong style='color: #2563eb;'>Analysis Complete
#>  <span style='color: #374151;'>Time-dependent ROC analysis completed.
#>  194 observations, 126 events (64.9%), weighting: marginal.
#>
#>  Time-Dependent ROC Analysis Results
#>
#>  Marker Variable: GeneScore
#>
#>  Analysis Method: Cumulative/Dynamic (Kaplan-Meier weighting)
#>
#>  Sample Size: 194 observations, 126 events (64.9%)
#>
#>  Confidence Intervals: Asymptotic (influence function-based)
#>
#>  AUC Interpretation by Timepoint:
#>
#>  At 12 months:
#>
#>  AUC = 0.740 (95% CI: 0.659 - 0.822)
#>
#>  Performance: fair (0.70-0.79) (p = 0.000, significantly better than
#>  chance)
#>
#>  At 36 months:
#>
#>  AUC = 0.755 (95% CI: 0.684 - 0.826)
#>
#>  Performance: fair (0.70-0.79) (p = 0.000, significantly better than
#>  chance)
#>
#>  At 60 months:
#>
#>  AUC = 0.763 (95% CI: 0.686 - 0.840)
#>
#>  Performance: fair (0.70-0.79) (p = 0.000, significantly better than
#>  chance)
#>
#>  Area Under ROC Curve (AUC)
#>  ────────────────────────────────────────────────────────────────────────
#>    Timepoint    AUC          SE            95% CI Lower    95% CI Upper
#>  ────────────────────────────────────────────────────────────────────────
#>           12    0.7400000    0.04200000       0.6580000       0.8230000
#>           36    0.7550000    0.03600000       0.6840000       0.8250000
#>           60    0.7630000    0.03900000       0.6870000       0.8390000
#>  ────────────────────────────────────────────────────────────────────────
#>
#>
#>  Marker Variable Statistics
#>  ──────────────────────────
#>    Statistic     Value
#>  ──────────────────────────
#>    N             194
#>    Mean          4.833
#>    Median        4.815
#>    SD            1.947
#>    IQR           2.367
#>    Min           0
#>    Max           9.57
#>    Events        126
#>    Event Rate    64.9%
#>  ──────────────────────────
#>
#>
#>  Optimal Cutoff Values
#>  ─────────────────────────────────────────────────────────────────────────────
#>    Timepoint    Optimal Cutoff    Sensitivity    Specificity    Youden Index
#>  ─────────────────────────────────────────────────────────────────────────────
#>  ─────────────────────────────────────────────────────────────────────────────
#>
#>
#>  Model Performance Comparison
#>
#>  Comparison to Baseline (AUC = 0.5):
#>
#>  At 12 months:
#>
#>  Improvement: +24.0% (AUC: 0.740 vs 0.50)
#>
#>  p = 0.0000 (significant)
#>
#>  At 36 months:
#>
#>  Improvement: +25.5% (AUC: 0.755 vs 0.50)
#>
#>  p = 0.0000 (significant)
#>
#>  At 60 months:
#>
#>  Improvement: +26.3% (AUC: 0.763 vs 0.50)
#>
#>  p = 0.0000 (significant)
#>
#>  Clinical Interpretation
#>
#>
#>
#>  Overall Performance:
#>
#>  The GeneScore shows fair to good discriminative ability (mean AUC =
#>  0.753).
#>
#>
#>
#>  Time Trend:
#>
#>  Performance shows a improving trend over time.
#>
#>
#>
#>  Clinical Utility:
#>
#>
#>  Best Performance: At 60 months (AUC = 0.763)
#>  Threshold: AUC >= 0.70 is generally considered clinically useful
#>  Assessment: The marker shows clinically relevant predictive ability
#>
#>
#>
#>  Method: This analysis uses Kaplan-Meier (marginal) weighting for
#>  censoring adjustment, appropriate when censoring is independent of
#>  marker values.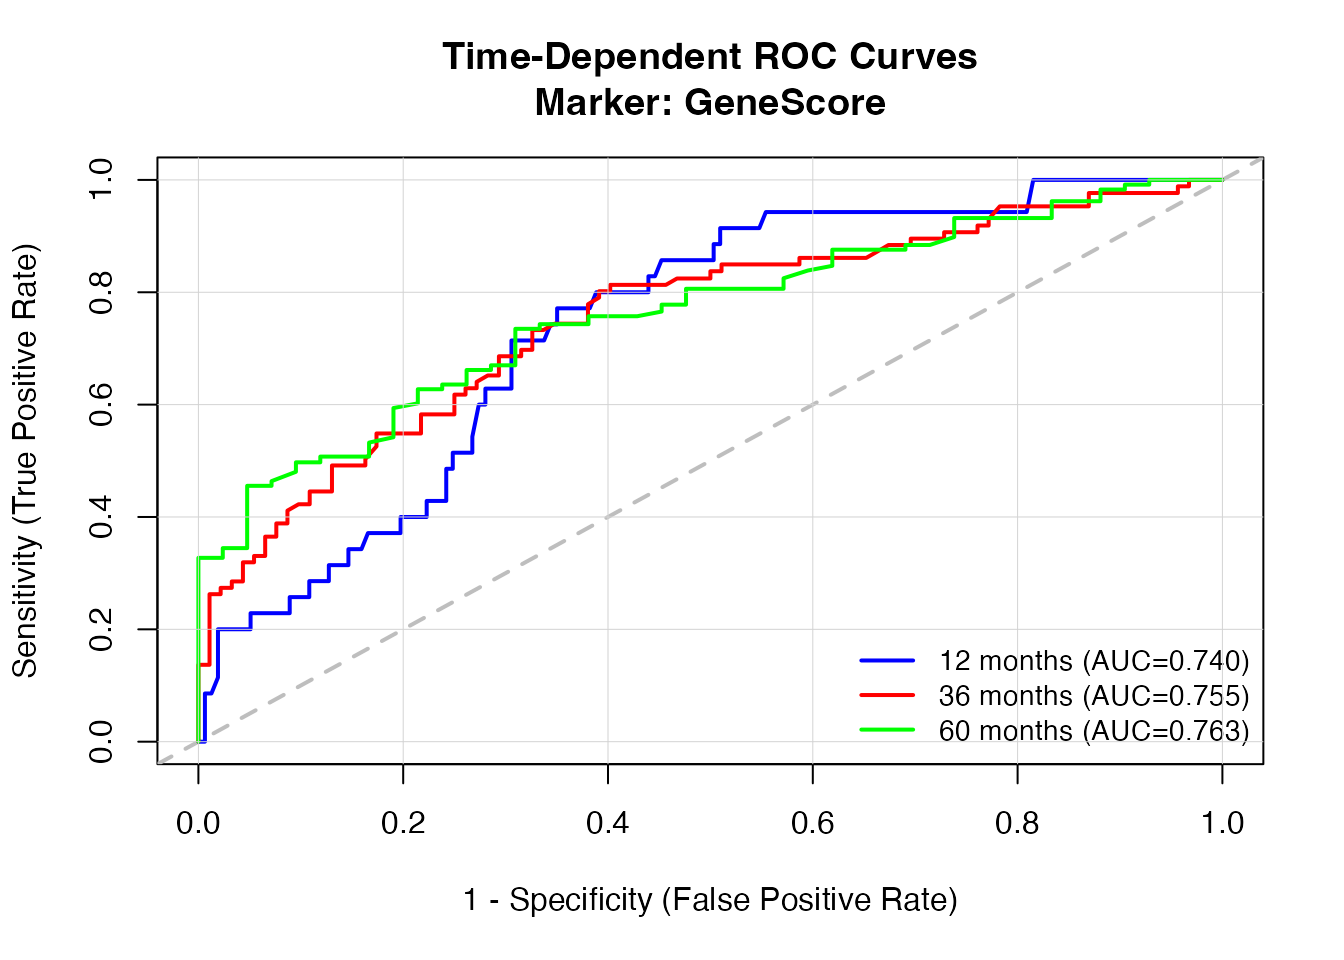
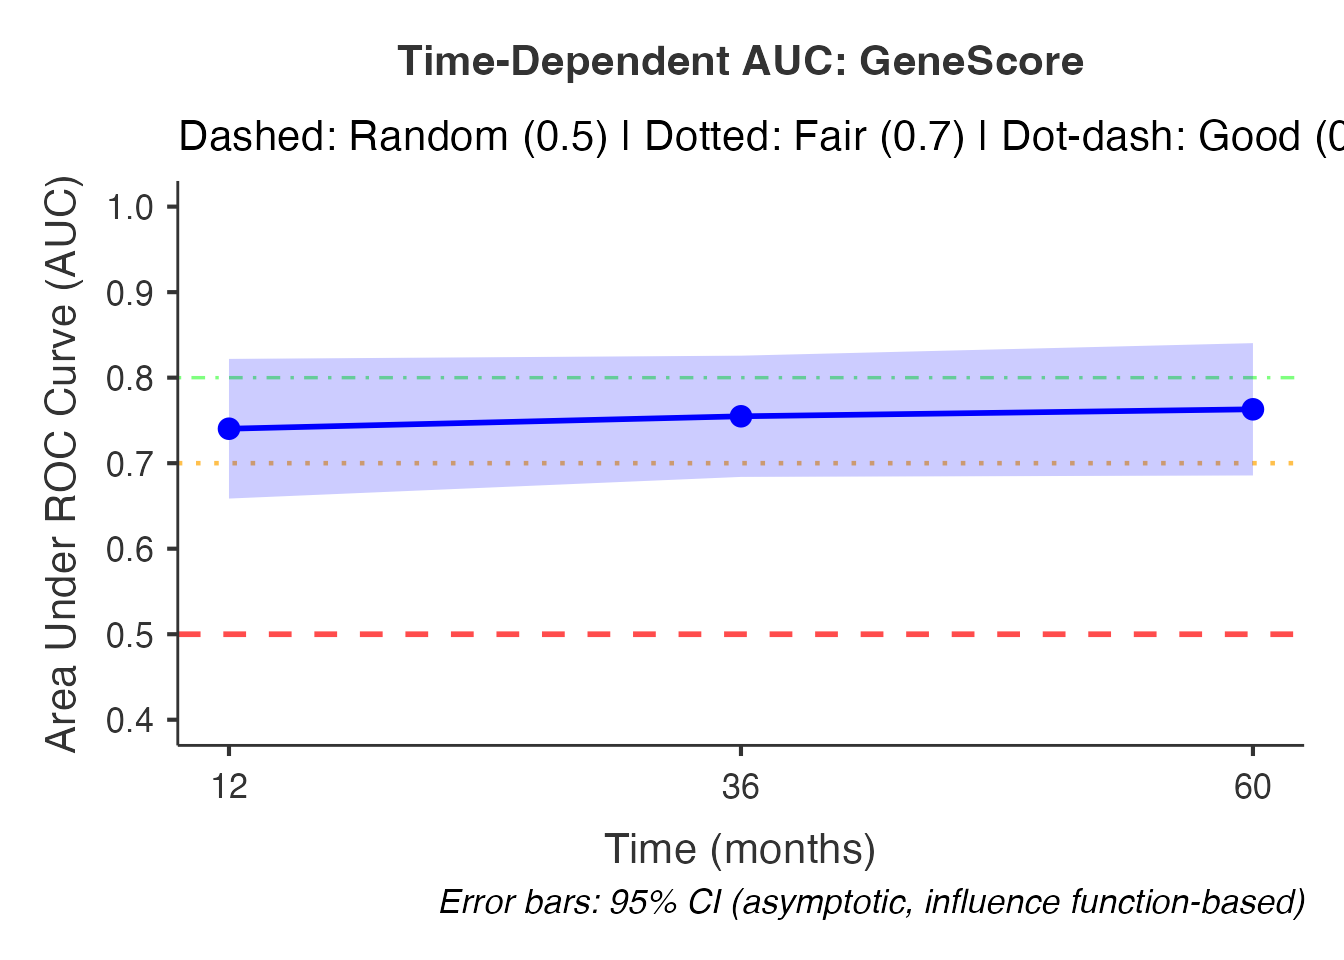
12. References
Statistical Methods
- Blanche P, Dartigues JF, Jacqmin-Gadda H (2013). Estimating and comparing time-dependent areas under receiver operating characteristic curves for censored event times with competing risks. Statistics in Medicine, 32(30), 5381-5397.
- Hung H, Chiang CT (2010). Estimation methods for time-dependent AUC models with survival data. Canadian Journal of Statistics, 38(1), 8-26.
- DeLong ER, DeLong DM, Clarke-Pearson DL (1988). Comparing the areas under two or more correlated receiver operating characteristic curves: a nonparametric approach. Biometrics, 44(3), 837-845.
- Robin X, Turck N, Hainard A, et al. (2011). pROC: an open-source package for R and S+ to analyze and compare ROC curves. BMC Bioinformatics, 12, 77.
- Youden WJ (1950). Index for rating diagnostic tests. Cancer, 3(1), 32-35.
R Packages
- timeROC: Time-dependent ROC curve estimation
- pROC: Binary ROC curve analysis, DeLong test, bootstrap comparison
- ggplot2: AUC-over-time plot visualization
- glue: HTML template rendering
- scales: Axis label formatting
AUC Interpretation Guidelines
| AUC Range | Interpretation | Clinical Guidance |
|---|---|---|
| 0.90-1.00 | Excellent | Strong discriminative ability; suitable for clinical decision-making |
| 0.80-0.89 | Good | Useful for clinical purposes with appropriate validation |
| 0.70-0.79 | Fair | Limited but potentially useful in combination with other markers |
| 0.60-0.69 | Poor | Insufficient for standalone clinical use |
| 0.50-0.59 | Fail | No better than random chance |
| < 0.50 | Reversed | Marker direction likely inverted; consider negating values |