Cardiac Biomarkers and Heart Failure Events Data
Source:R/joint_modeling_data.R
cardiac_joint_data.RdA longitudinal dataset containing NT-proBNP measurements and heart failure events for 120 cardiac patients.
Format
A data frame with 964 observations and 8 variables:
- patient_id
Character. Unique patient identifier (HF_001 to HF_120)
- age
Numeric. Patient age at baseline (years)
- nyha_class
Factor. NYHA functional class (Class 1, Class 2, Class 3, Class 4)
- baseline_ef
Numeric. Baseline ejection fraction (%)
- visit_time
Numeric. Time of NT-proBNP measurement (months from baseline)
- nt_probnp
Numeric. NT-proBNP level (pg/mL)
- survival_time
Numeric. Time to heart failure event or last follow-up (months)
- hf_event_status
Numeric. Event indicator (0 = censored, 1 = heart failure hospitalization/death)
Details
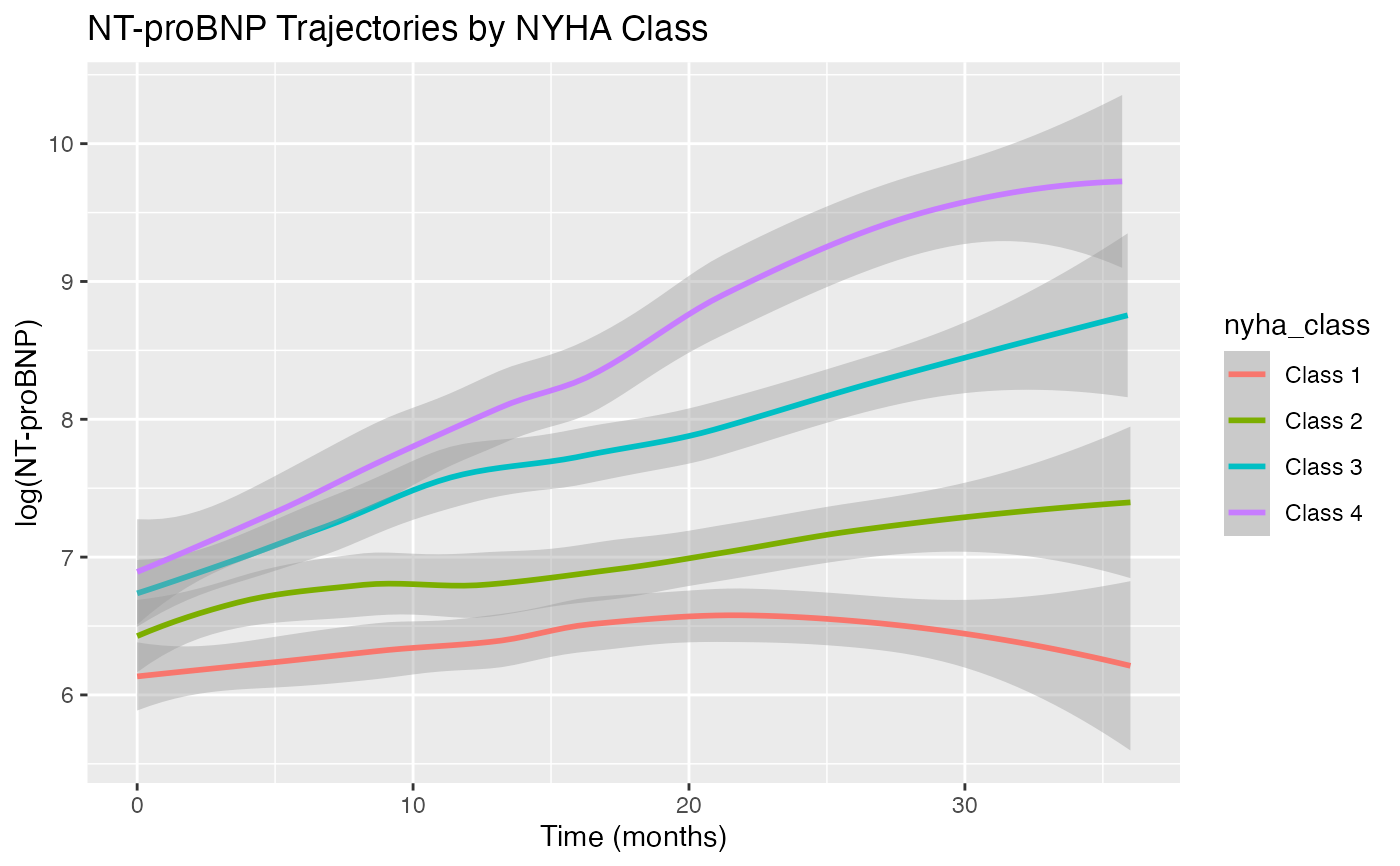
The dataset simulates heart failure progression where:
NT-proBNP levels generally increase over time
Higher NYHA class associated with higher NT-proBNP
Higher NT-proBNP increases hazard of heart failure events
Regular monitoring every ~4 months
20% event rate over 36 months follow-up
Examples
data(cardiac_joint_data)

# NT-proBNP trajectories by NYHA class
library(ggplot2)
ggplot(cardiac_joint_data, aes(x = visit_time, y = log(nt_probnp), color = nyha_class)) +
  geom_smooth(method = "loess") +
  labs(title = "NT-proBNP Trajectories by NYHA Class",
       x = "Time (months)", y = "log(NT-proBNP)")
#> `geom_smooth()` using formula = 'y ~ x'