A longitudinal dataset containing CD4 count measurements and AIDS progression outcomes for 180 HIV patients.
Format
A data frame with 1341 observations and 8 variables:
- patient_id
Character. Unique patient identifier (HIV_001 to HIV_180)
- age
Numeric. Patient age at baseline (years)
- baseline_viral_load
Numeric. Baseline viral load (copies/mL)
- art_adherence
Factor. Antiretroviral therapy adherence (Poor, Good)
- visit_time
Numeric. Time of CD4 measurement (months from baseline)
- cd4_count
Numeric. CD4+ T cell count (cells/uL)
- survival_time
Numeric. Time to AIDS/death or last follow-up (months)
- aids_death_status
Numeric. Event indicator (0 = censored, 1 = AIDS/death)
Details
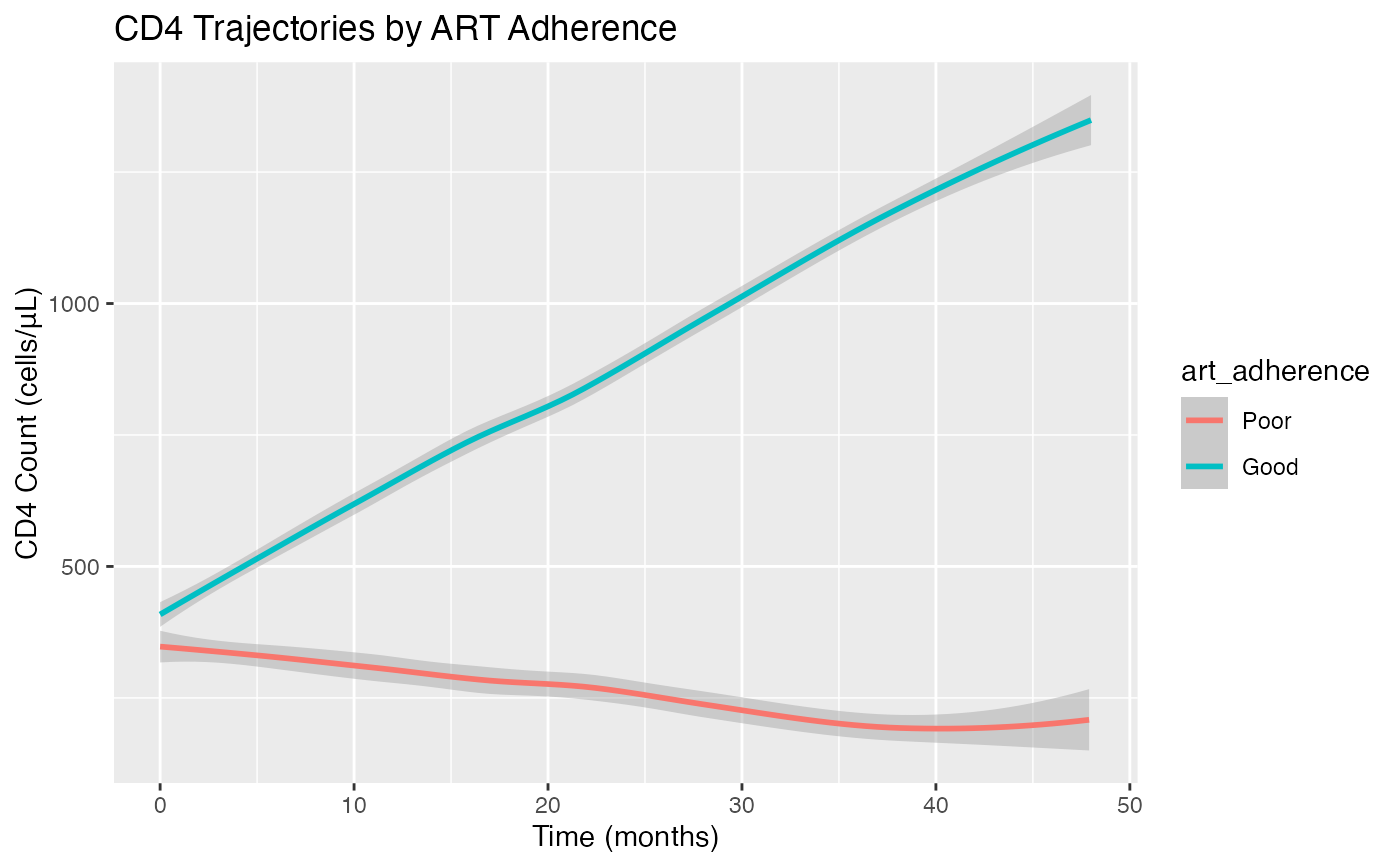
The dataset simulates HIV disease progression where:
CD4 counts generally increase with good ART adherence
Poor adherence leads to CD4 decline
Lower CD4 counts increase hazard of AIDS/death
Regular monitoring every ~6 months
Low event rate (1.1%) reflecting modern HIV care
Examples
data(cd4_joint_data)

# Compare CD4 trajectories by adherence
library(ggplot2)
ggplot(cd4_joint_data, aes(x = visit_time, y = cd4_count, color = art_adherence)) +
  geom_smooth(method = "loess") +
  labs(title = "CD4 Trajectories by ART Adherence",
       x = "Time (months)", y = "CD4 Count (cells/uL)")
#> `geom_smooth()` using formula = 'y ~ x'