decisioncompare Imaging Data - Multi-Modality Comparison
Source:R/data_decisioncompare_docs.R
decisioncompare_imaging.RdDataset with 220 patients comparing three imaging modalities (CT, MRI, Biomarker) against pathology gold standard for cancer detection.
Format
A data frame with 220 rows and 5 variables:
- patient_id
Character: Patient identifier (PT001-PT220)
- Pathology
Factor: Pathology result ("Benign", "Malignant"), 28% malignant
- CT_Scan
Factor: CT result ("Normal", "Abnormal"), Sens=0.88, Spec=0.85
- MRI
Factor: MRI result ("Normal", "Abnormal"), Sens=0.92, Spec=0.90
- Biomarker
Factor: Biomarker test ("Normal", "Elevated"), Sens=0.80, Spec=0.88
- tumor_size_mm
Numeric: Tumor size in mm (mean: 35 for malignant, 15 for benign)
Details
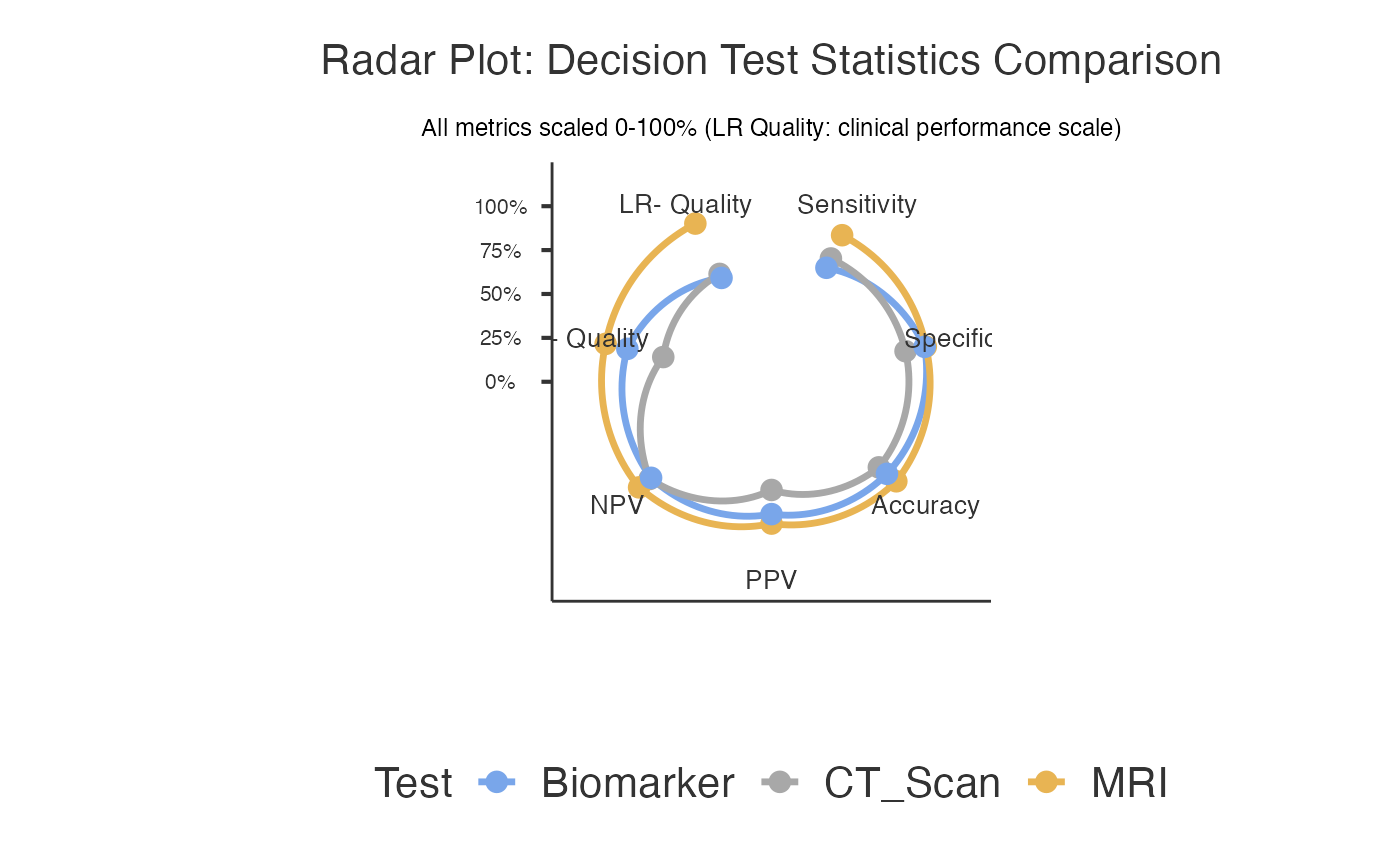
Realistic imaging comparison scenario. MRI shows highest sensitivity and specificity. Biomarker offers non-invasive alternative with good specificity.
Examples
data(decisioncompare_imaging)
decisioncompare(data = decisioncompare_imaging, gold = "Pathology",
                goldPositive = "Malignant", test1 = "CT_Scan",
                test1Positive = "Abnormal", test2 = "MRI",
                test2Positive = "Abnormal", test3 = "Biomarker",
                test3Positive = "Elevated", radarplot = TRUE)
#>
#>  COMPARE MEDICAL DECISION TESTS
#>
#> character(0)
#>
#>  Test 1 - Recoded Data
#>  ────────────────────────────────────────────────────────────────
#>                     Gold Positive    Gold Negative    Total
#>  ────────────────────────────────────────────────────────────────
#>    Test Positive         53.00000         33.00000     86.00000
#>    Test Negative         15.00000        119.00000    134.00000
#>    Total                 68.00000        152.00000    220.00000
#>  ────────────────────────────────────────────────────────────────
#>
#>
#>  Test 2 - Recoded Data
#>  ────────────────────────────────────────────────────────────────
#>                     Gold Positive    Gold Negative    Total
#>  ────────────────────────────────────────────────────────────────
#>    Test Positive        63.000000         15.00000     78.00000
#>    Test Negative         5.000000        137.00000    142.00000
#>    Total                68.000000        152.00000    220.00000
#>  ────────────────────────────────────────────────────────────────
#>
#>
#>  Test 3 - Recoded Data
#>  ────────────────────────────────────────────────────────────────
#>                     Gold Positive    Gold Negative    Total
#>  ────────────────────────────────────────────────────────────────
#>    Test Positive         49.00000         16.00000     65.00000
#>    Test Negative         19.00000        136.00000    155.00000
#>    Total                 68.00000        152.00000    220.00000
#>  ────────────────────────────────────────────────────────────────
#>
#>
#>  Decision Test Comparison
#>  ──────────────────────────────────────────────────────────────────────────────────────────────────────────────────────────────────────────────────────────────────────────────────────────────────────────────────────────────────────────────────────
#>    Test                                                                                   Sensitivity    Specificity    Accuracy     Positive Predictive Value    Negative Predictive Value    Positive Likelihood Ratio    Negative Likelihood Ratio
#>  ──────────────────────────────────────────────────────────────────────────────────────────────────────────────────────────────────────────────────────────────────────────────────────────────────────────────────────────────────────────────────────
#>    CT_Scan                                                                                   77.94118       78.28947     78.18182                     61.62791                     88.80597                     3.590018                   0.28175976
#>      → Limited diagnostic utility - consider combining with other tests
#>    MRI                                                                                       92.64706       90.13158     90.90909                     80.76923                     96.47887                     9.388235                   0.08158008
#>      → Good balanced performance; Moderate positive evidence; Strong negative evidence
#>    Biomarker                                                                                 72.05882       89.47368     84.09091                     75.38462                     87.74194                     6.845588                   0.31228374
#>      → Good specificity for confirmation; Moderate positive evidence
#>  ──────────────────────────────────────────────────────────────────────────────────────────────────────────────────────────────────────────────────────────────────────────────────────────────────────────────────────────────────────────────────────
#>
#>
#>  Stratified Diagnostic Accuracy
#>  ───────────────────────────────────────────────────────────────────────────────────────────────────────────
#>    Subgroup    N    Test    Sensitivity    Specificity    Accuracy     PPV          NPV          OPA
#>  ───────────────────────────────────────────────────────────────────────────────────────────────────────────
#>  ───────────────────────────────────────────────────────────────────────────────────────────────────────────
#>
#>
#>  <div style="font-family: Arial, sans-serif; max-width: 800px; margin:
#>  0 auto; padding: 20px;"><h2 style="color: #2c3e50; border-bottom: 2px
#>  solid #3498db;"> Clinical Summary
#>
#>  Among the tests evaluated, MRI demonstrated optimal diagnostic
#>  performance with 92.6% sensitivity (95% CI: [see confidence interval
#>  table]), 90.1% specificity (95% CI: [see confidence interval table]),
#>  80.8% positive predictive value, 96.5% negative predictive value, and
#>  90.9% overall accuracy. The likelihood ratio for positive results was
#>  9.39 and for negative results was 0.08.<h3 style="color: #27ae60;
#>  margin-top: 30px;"> Report Sentences
#>
#>  <div style="background-color: #f8f9fa; padding: 15px; border-left: 4px
#>  solid #28a745; margin: 15px 0;"><h4 style="margin-top: 0;">Methods
#>  Section:
#>
#>  <p style="font-style: italic; line-height: 1.6;">We compared the
#>  diagnostic performance of 3 tests (CT_Scan, MRI, Biomarker) against
#>  the gold standard reference using diagnostic accuracy analysis. The
#>  study included 220 cases with complete data. Performance metrics
#>  calculated included sensitivity, specificity, positive and negative
#>  predictive values, likelihood ratios, and overall accuracy.
#>
#>  <div style="background-color: #e8f4f8; padding: 15px; border-left: 4px
#>  solid #3498db; margin: 15px 0;"><h4 style="margin-top: 0;">Results
#>  Section:
#>
#>  <p style="font-style: italic; line-height: 1.6;">Among the tests
#>  evaluated, MRI demonstrated optimal diagnostic performance with 92.6%
#>  sensitivity (95% CI: [see confidence interval table]), 90.1%
#>  specificity (95% CI: [see confidence interval table]), 80.8% positive
#>  predictive value, 96.5% negative predictive value, and 90.9% overall
#>  accuracy. The likelihood ratio for positive results was 9.39 and for
#>  negative results was 0.08.
#>
#>  <h3 style="color: #8e44ad; margin-top: 30px;"> Clinical
#>  Recommendations
#>
#>  <div style="background-color: #fff3cd; padding: 15px; border-radius:
#>  8px;">
#>
#>  Clinical Consideration: Consider using MRI in combination with other
#>  tests for optimal diagnostic accuracy.
#>
#>  Implementation Note: Results should be interpreted in the context of
#>  disease prevalence in your clinical population. Consider local
#>  validation studies before implementation.
#>
#>  <div style="font-family: Arial, sans-serif; max-width: 900px; margin:
#>  0 auto; padding: 20px;"><h2 style="color: #2c3e50; text-align: center;
#>  border-bottom: 2px solid #3498db; padding-bottom: 10px;"> About
#>  Medical Decision Test Comparison
#>
#>  <div style="background: linear-gradient(135deg, #e3f2fd 0%, #bbdefb
#>  100%); padding: 20px; border-radius: 10px; margin: 20px 0;"><h3
#>  style="color: #1565c0; margin-top: 0;"> What This Analysis Does
#>
#>  <p style="line-height: 1.6; color: #333;">This tool compares the
#>  diagnostic performance of multiple medical tests against a gold
#>  standard reference. It systematically evaluates sensitivity,
#>  specificity, predictive values, likelihood ratios, and overall
#>  accuracy to help you determine which test performs best for your
#>  clinical scenario.
#>
#>  <div style="background-color: #f1f8e9; border: 1px solid #8bc34a;
#>  padding: 20px; border-radius: 8px; margin: 20px 0;"><h3 style="color:
#>  #4a7c59; margin-top: 0;"> When to Use This Analysis
#>
#>  <ul style="line-height: 1.8; color: #4a7c59;">Test Validation:
#>  Comparing new diagnostic methods against established standardsMethod
#>  Comparison: Evaluating which of several tests performs betterClinical
#>  Research: Validating biomarkers, imaging techniques, or clinical
#>  assessmentsQuality Assessment: Measuring agreement between different
#>  raters or methodsProtocol Development: Optimizing diagnostic
#>  workflows<div style="background-color: #fff3e0; border: 1px solid
#>  #ff9800; padding: 20px; border-radius: 8px; margin: 20px 0;"><h3
#>  style="color: #e65100; margin-top: 0;"> How to Use This Analysis
#>
#>  <ol style="line-height: 1.8; color: #e65100;">Select Gold Standard:
#>  Choose your most reliable reference test (e.g., biopsy, expert
#>  consensus)Choose Tests to Compare: Select 2-3 diagnostic tests you
#>  want to evaluateDefine Positive Levels: Specify what constitutes a
#>  "positive" result for each testConfigure Options: Enable statistical
#>  comparisons, confidence intervals, or visualizations as neededRun
#>  Analysis: Review results tables and clinical interpretationsCopy
#>  Report: Use the auto-generated sentences for your documentation<div
#>  style="background-color: #f3e5f5; border: 1px solid #9c27b0; padding:
#>  20px; border-radius: 8px; margin: 20px 0;"><h3 style="color: #6a1b9a;
#>  margin-top: 0;"> Key Metrics Explained
#>
#>  <div style="display: grid; grid-template-columns: 1fr 1fr; gap: 15px;
#>  color: #6a1b9a;">
#>
#>  Sensitivity: Probability test is positive when disease present
#>  (rule-out ability)
#>
#>  Specificity: Probability test is negative when disease absent (rule-in
#>  ability)
#>
#>  PPV: Probability of disease when test positive
#>
#>  NPV: Probability of no disease when test negative
#>
#>  LR+: How much positive test increases odds of disease
#>
#>  LR-: How much negative test decreases odds of disease
#>
#>  Accuracy: Overall probability of correct classification
#>
#>  McNemar Test: Statistical comparison between paired tests
#>
#>  <div style="background-color: #e8f5e8; border: 1px solid #4caf50;
#>  padding: 20px; border-radius: 8px; margin: 20px 0;"><h3 style="color:
#>  #2e7d32; margin-top: 0;"> Clinical Interpretation Guidelines
#>
#>  <div style="display: grid; grid-template-columns: 1fr 1fr; gap: 15px;
#>  color: #2e7d32;"><h4 style="margin-bottom: 5px;">Screening Tests
#>  (Rule-Out):
#>
#>  <p style="margin-top: 0;">• Sensitivity >=95%: Excellent
#>  • NPV >=95%: High confidence
#>  • Goal: Minimize false negatives
#>
#>  <h4 style="margin-bottom: 5px;">Confirmatory Tests (Rule-In):
#>
#>  <p style="margin-top: 0;">• Specificity >=95%: Excellent
#>  • PPV >=90%: High confidence
#>  • Goal: Minimize false positives
#>
#>  <div style="background-color: #fff8e1; border: 1px solid #ffc107;
#>  padding: 20px; border-radius: 8px; margin: 20px 0;"><h3 style="color:
#>  #f57f17; margin-top: 0;"> Important Assumptions & Limitations
#>
#>  <ul style="line-height: 1.6; color: #f57f17;">Gold Standard: Assumes
#>  your reference test is truly accurateSample Size: Results more
#>  reliable with larger, representative samplesPrevalence Dependency: PPV
#>  and NPV vary with disease prevalenceMcNemar Test: Requires
#>  paired/matched data for statistical comparisonsMissing Data: Cases
#>  with incomplete data are excluded from analysisConfidence Intervals:
#>  Calculated using Wilson method for better accuracy
#>
#>  <div style='margin: 10px 0;'><div style='background-color: #eff6ff;
#>  border-left: 4px solid #93c5fd; padding: 12px; margin: 8px 0;
#>  border-radius: 4px;'><strong style='color: #2563eb;'> Analysis
#>  Completed Successfully
#>  <span style='color: #374151;'>3 diagnostic tests compared using 220
#>  complete cases. Gold standard identified 68 diseased and 152 healthy
#>  cases. Review comparison tables and statistical tests below.
#> Warning: The `size` argument of `element_line()` is deprecated as of ggplot2 3.4.0.
#> ℹ Please use the `linewidth` argument instead.
#> ℹ The deprecated feature was likely used in the jmvcore package.
#>   Please report the issue at <https://github.com/jamovi/jamovi/issues>.