Dataset with 180 patients comparing three tests with complementary characteristics: high sensitivity (0.90), balanced (0.85/0.88), and high specificity (0.78/0.92).
Format
A data frame with 180 rows and 5 variables:
- patient_id
Character: Patient identifier (PT001-PT180)
- GoldStandard
Factor: True disease status ("Negative", "Positive"), 35% prevalence
- Test1
Factor: High sensitivity test ("Negative", "Positive"), Sens=0.90, Spec=0.85
- Test2
Factor: Balanced test ("Negative", "Positive"), Sens=0.85, Spec=0.88
- Test3
Factor: High specificity test ("Negative", "Positive"), Sens=0.78, Spec=0.92
- test_site
Factor: Testing site (Site_A, Site_B, Site_C)
Details
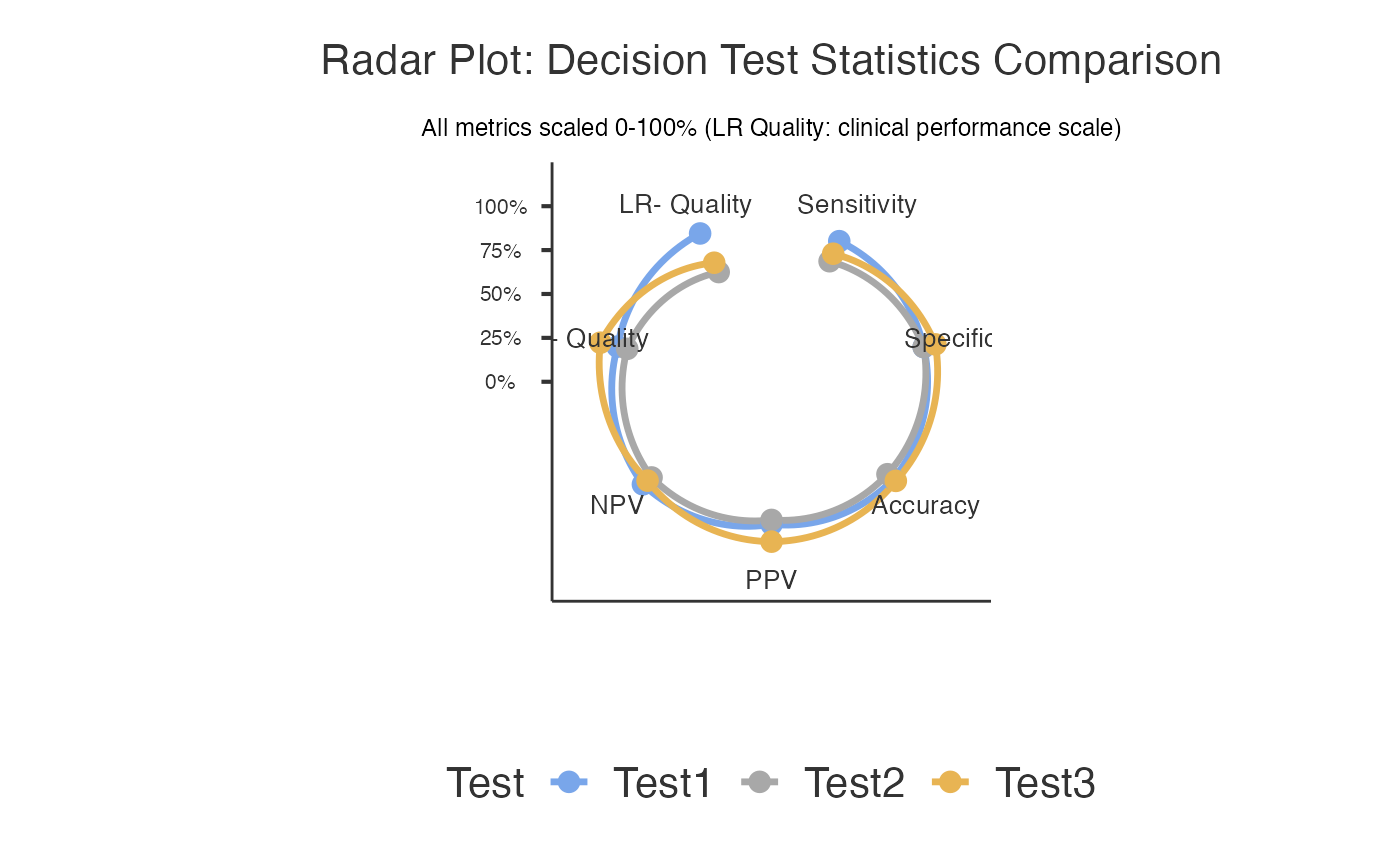
Demonstrates three-way comparison with complementary test characteristics. Ideal for radar plot visualization and comprehensive test evaluation.
Examples
data(decisioncompare_threetest)
decisioncompare(data = decisioncompare_threetest, gold = "GoldStandard",
                goldPositive = "Positive", test1 = "Test1",
                test1Positive = "Positive", test2 = "Test2",
                test2Positive = "Positive", test3 = "Test3",
                test3Positive = "Positive", radarplot = TRUE)
#>
#>  COMPARE MEDICAL DECISION TESTS
#>
#> character(0)
#>
#>  Test 1 - Recoded Data
#>  ────────────────────────────────────────────────────────────────
#>                     Gold Positive    Gold Negative    Total
#>  ────────────────────────────────────────────────────────────────
#>    Test Positive        56.000000         13.00000     69.00000
#>    Test Negative         7.000000        104.00000    111.00000
#>    Total                63.000000        117.00000    180.00000
#>  ────────────────────────────────────────────────────────────────
#>
#>
#>  Test 2 - Recoded Data
#>  ────────────────────────────────────────────────────────────────
#>                     Gold Positive    Gold Negative    Total
#>  ────────────────────────────────────────────────────────────────
#>    Test Positive         48.00000         13.00000     61.00000
#>    Test Negative         15.00000        104.00000    119.00000
#>    Total                 63.00000        117.00000    180.00000
#>  ────────────────────────────────────────────────────────────────
#>
#>
#>  Test 3 - Recoded Data
#>  ────────────────────────────────────────────────────────────────
#>                     Gold Positive    Gold Negative    Total
#>  ────────────────────────────────────────────────────────────────
#>    Test Positive         51.00000         5.000000     56.00000
#>    Test Negative         12.00000       112.000000    124.00000
#>    Total                 63.00000       117.000000    180.00000
#>  ────────────────────────────────────────────────────────────────
#>
#>
#>  Decision Test Comparison
#>  ─────────────────────────────────────────────────────────────────────────────────────────────────────────────────────────────────────────────────────────────────────────────────────────────────────────────────────────────────────────────────────────────────
#>    Test                                                                                              Sensitivity    Specificity    Accuracy     Positive Predictive Value    Negative Predictive Value    Positive Likelihood Ratio    Negative Likelihood Ratio
#>  ─────────────────────────────────────────────────────────────────────────────────────────────────────────────────────────────────────────────────────────────────────────────────────────────────────────────────────────────────────────────────────────────────
#>    Test1                                                                                                88.88889       88.88889     88.88889                     81.15942                     93.69369                     8.000000                    0.1250000
#>      → Good balanced performance; Moderate positive evidence; Moderate negative evidence
#>    Test2                                                                                                76.19048       88.88889     84.44444                     78.68852                     87.39496                     6.857143                    0.2678571
#>      → Good specificity for confirmation; Moderate positive evidence
#>    Test3                                                                                                80.95238       95.72650     90.55556                     91.07143                     90.32258                    18.942857                    0.1989796
#>      → Excellent for confirmation (rule-in); Strong positive evidence; Moderate negative evidence
#>  ─────────────────────────────────────────────────────────────────────────────────────────────────────────────────────────────────────────────────────────────────────────────────────────────────────────────────────────────────────────────────────────────────
#>
#>
#>  Stratified Diagnostic Accuracy
#>  ───────────────────────────────────────────────────────────────────────────────────────────────────────────
#>    Subgroup    N    Test    Sensitivity    Specificity    Accuracy     PPV          NPV          OPA
#>  ───────────────────────────────────────────────────────────────────────────────────────────────────────────
#>  ───────────────────────────────────────────────────────────────────────────────────────────────────────────
#>
#>
#>  <div style="font-family: Arial, sans-serif; max-width: 800px; margin:
#>  0 auto; padding: 20px;"><h2 style="color: #2c3e50; border-bottom: 2px
#>  solid #3498db;"> Clinical Summary
#>
#>  Among the tests evaluated, Test3 demonstrated optimal diagnostic
#>  performance with 81% sensitivity (95% CI: [see confidence interval
#>  table]), 95.7% specificity (95% CI: [see confidence interval table]),
#>  91.1% positive predictive value, 90.3% negative predictive value, and
#>  90.6% overall accuracy. The likelihood ratio for positive results was
#>  18.94 and for negative results was 0.20.<h3 style="color: #27ae60;
#>  margin-top: 30px;"> Report Sentences
#>
#>  <div style="background-color: #f8f9fa; padding: 15px; border-left: 4px
#>  solid #28a745; margin: 15px 0;"><h4 style="margin-top: 0;">Methods
#>  Section:
#>
#>  <p style="font-style: italic; line-height: 1.6;">We compared the
#>  diagnostic performance of 3 tests (Test1, Test2, Test3) against the
#>  gold standard reference using diagnostic accuracy analysis. The study
#>  included 180 cases with complete data. Performance metrics calculated
#>  included sensitivity, specificity, positive and negative predictive
#>  values, likelihood ratios, and overall accuracy.
#>
#>  <div style="background-color: #e8f4f8; padding: 15px; border-left: 4px
#>  solid #3498db; margin: 15px 0;"><h4 style="margin-top: 0;">Results
#>  Section:
#>
#>  <p style="font-style: italic; line-height: 1.6;">Among the tests
#>  evaluated, Test3 demonstrated optimal diagnostic performance with 81%
#>  sensitivity (95% CI: [see confidence interval table]), 95.7%
#>  specificity (95% CI: [see confidence interval table]), 91.1% positive
#>  predictive value, 90.3% negative predictive value, and 90.6% overall
#>  accuracy. The likelihood ratio for positive results was 18.94 and for
#>  negative results was 0.20.
#>
#>  <h3 style="color: #8e44ad; margin-top: 30px;"> Clinical
#>  Recommendations
#>
#>  <div style="background-color: #fff3cd; padding: 15px; border-radius:
#>  8px;">
#>
#>  Confirmatory Application: Test3 is excellent for confirming diagnosis
#>  due to high specificity (low false positive rate).
#>
#>  Implementation Note: Results should be interpreted in the context of
#>  disease prevalence in your clinical population. Consider local
#>  validation studies before implementation.
#>
#>  <div style="font-family: Arial, sans-serif; max-width: 900px; margin:
#>  0 auto; padding: 20px;"><h2 style="color: #2c3e50; text-align: center;
#>  border-bottom: 2px solid #3498db; padding-bottom: 10px;"> About
#>  Medical Decision Test Comparison
#>
#>  <div style="background: linear-gradient(135deg, #e3f2fd 0%, #bbdefb
#>  100%); padding: 20px; border-radius: 10px; margin: 20px 0;"><h3
#>  style="color: #1565c0; margin-top: 0;"> What This Analysis Does
#>
#>  <p style="line-height: 1.6; color: #333;">This tool compares the
#>  diagnostic performance of multiple medical tests against a gold
#>  standard reference. It systematically evaluates sensitivity,
#>  specificity, predictive values, likelihood ratios, and overall
#>  accuracy to help you determine which test performs best for your
#>  clinical scenario.
#>
#>  <div style="background-color: #f1f8e9; border: 1px solid #8bc34a;
#>  padding: 20px; border-radius: 8px; margin: 20px 0;"><h3 style="color:
#>  #4a7c59; margin-top: 0;"> When to Use This Analysis
#>
#>  <ul style="line-height: 1.8; color: #4a7c59;">Test Validation:
#>  Comparing new diagnostic methods against established standardsMethod
#>  Comparison: Evaluating which of several tests performs betterClinical
#>  Research: Validating biomarkers, imaging techniques, or clinical
#>  assessmentsQuality Assessment: Measuring agreement between different
#>  raters or methodsProtocol Development: Optimizing diagnostic
#>  workflows<div style="background-color: #fff3e0; border: 1px solid
#>  #ff9800; padding: 20px; border-radius: 8px; margin: 20px 0;"><h3
#>  style="color: #e65100; margin-top: 0;"> How to Use This Analysis
#>
#>  <ol style="line-height: 1.8; color: #e65100;">Select Gold Standard:
#>  Choose your most reliable reference test (e.g., biopsy, expert
#>  consensus)Choose Tests to Compare: Select 2-3 diagnostic tests you
#>  want to evaluateDefine Positive Levels: Specify what constitutes a
#>  "positive" result for each testConfigure Options: Enable statistical
#>  comparisons, confidence intervals, or visualizations as neededRun
#>  Analysis: Review results tables and clinical interpretationsCopy
#>  Report: Use the auto-generated sentences for your documentation<div
#>  style="background-color: #f3e5f5; border: 1px solid #9c27b0; padding:
#>  20px; border-radius: 8px; margin: 20px 0;"><h3 style="color: #6a1b9a;
#>  margin-top: 0;"> Key Metrics Explained
#>
#>  <div style="display: grid; grid-template-columns: 1fr 1fr; gap: 15px;
#>  color: #6a1b9a;">
#>
#>  Sensitivity: Probability test is positive when disease present
#>  (rule-out ability)
#>
#>  Specificity: Probability test is negative when disease absent (rule-in
#>  ability)
#>
#>  PPV: Probability of disease when test positive
#>
#>  NPV: Probability of no disease when test negative
#>
#>  LR+: How much positive test increases odds of disease
#>
#>  LR-: How much negative test decreases odds of disease
#>
#>  Accuracy: Overall probability of correct classification
#>
#>  McNemar Test: Statistical comparison between paired tests
#>
#>  <div style="background-color: #e8f5e8; border: 1px solid #4caf50;
#>  padding: 20px; border-radius: 8px; margin: 20px 0;"><h3 style="color:
#>  #2e7d32; margin-top: 0;"> Clinical Interpretation Guidelines
#>
#>  <div style="display: grid; grid-template-columns: 1fr 1fr; gap: 15px;
#>  color: #2e7d32;"><h4 style="margin-bottom: 5px;">Screening Tests
#>  (Rule-Out):
#>
#>  <p style="margin-top: 0;">• Sensitivity >=95%: Excellent
#>  • NPV >=95%: High confidence
#>  • Goal: Minimize false negatives
#>
#>  <h4 style="margin-bottom: 5px;">Confirmatory Tests (Rule-In):
#>
#>  <p style="margin-top: 0;">• Specificity >=95%: Excellent
#>  • PPV >=90%: High confidence
#>  • Goal: Minimize false positives
#>
#>  <div style="background-color: #fff8e1; border: 1px solid #ffc107;
#>  padding: 20px; border-radius: 8px; margin: 20px 0;"><h3 style="color:
#>  #f57f17; margin-top: 0;"> Important Assumptions & Limitations
#>
#>  <ul style="line-height: 1.6; color: #f57f17;">Gold Standard: Assumes
#>  your reference test is truly accurateSample Size: Results more
#>  reliable with larger, representative samplesPrevalence Dependency: PPV
#>  and NPV vary with disease prevalenceMcNemar Test: Requires
#>  paired/matched data for statistical comparisonsMissing Data: Cases
#>  with incomplete data are excluded from analysisConfidence Intervals:
#>  Calculated using Wilson method for better accuracy
#>
#>  <div style='margin: 10px 0;'><div style='background-color: #eff6ff;
#>  border-left: 4px solid #93c5fd; padding: 12px; margin: 8px 0;
#>  border-radius: 4px;'><strong style='color: #2563eb;'> Analysis
#>  Completed Successfully
#>  <span style='color: #374151;'>3 diagnostic tests compared using 180
#>  complete cases. Gold standard identified 63 diseased and 117 healthy
#>  cases. Review comparison tables and statistical tests below.