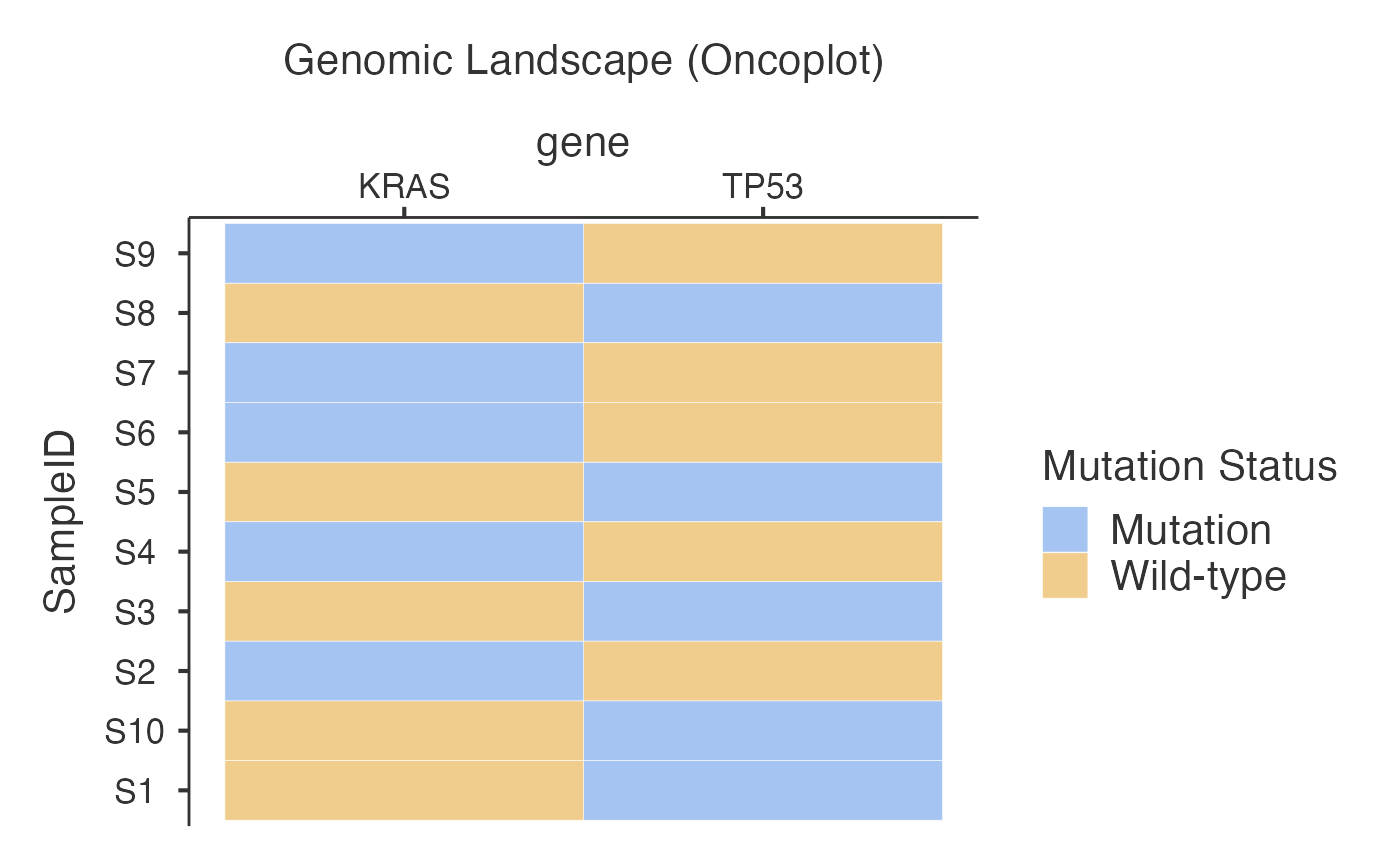
Creates oncoplots (mutation landscapes) to visualize genomic alterations across genes and samples with optional clinical annotations
Super classes
jmvcore::Analysis -> jjoncoplotBase -> jjoncoplotClass
Methods
Inherited methods
jmvcore::Analysis$.createImage()jmvcore::Analysis$.createImages()jmvcore::Analysis$.createPlotObject()jmvcore::Analysis$.getSessionTemp()jmvcore::Analysis$.load()jmvcore::Analysis$.render()jmvcore::Analysis$.save()jmvcore::Analysis$.savePart()jmvcore::Analysis$.setCheckpoint()jmvcore::Analysis$.setParent()jmvcore::Analysis$.setReadDatasetHeaderSource()jmvcore::Analysis$.setReadDatasetSource()jmvcore::Analysis$.setResourcesPathSource()jmvcore::Analysis$.setStatePathSource()jmvcore::Analysis$addAddon()jmvcore::Analysis$asProtoBuf()jmvcore::Analysis$asSource()jmvcore::Analysis$check()jmvcore::Analysis$init()jmvcore::Analysis$optionsChangedHandler()jmvcore::Analysis$postInit()jmvcore::Analysis$print()jmvcore::Analysis$readDataset()jmvcore::Analysis$run()jmvcore::Analysis$serialize()jmvcore::Analysis$setError()jmvcore::Analysis$setStatus()jmvcore::Analysis$translate()jjoncoplotBase$initialize()
Examples
data <- data.frame(
    SampleID = paste0("S", 1:10),
    TP53 = c(1, 0, 1, 0, 1, 0, 0, 1, 0, 1),
    KRAS = c(0, 1, 0, 1, 0, 1, 1, 0, 1, 0)
)
jjoncoplot(data, "SampleID", c("TP53", "KRAS"))
#>
#>  GENOMIC LANDSCAPE VISUALIZATION
#> Hierarchical Sorting
#> Hierarchical sorting algorithm applied: Samples are ordered using ggoncoplot's base-2 exponential weighting based on gene frequency rank. Most frequently mutated genes contribute exponentially more weight (2^rank) to sample ordering, creating intuitive visual patterns.
#>
#> Gene Selection Method
#> Gene selection: Displaying top 10 most frequently mutated genes from your dataset (2 total gene variables). Use "Specific Genes to Include" to focus on genes of clinical interest.
#>  <div style='background-color: #f8f9fa; border-radius: 8px; padding:
#>  15px; margin: 10px 0;'>
#>  <h3 style='color: #2c3e50; margin-top: 0;'> Genomic Landscape
#>  Visualization for Clinical Research
#>
#>  <div style='background-color: #e8f4fd; border-left: 4px solid #3498db;
#>  padding: 10px; margin: 10px 0;'>
#>  <h4 style='color: #2980b9; margin-top: 0;'> Clinical Applications
#>
#>  Oncoplots help pathologists and oncologists visualize mutation
#>  landscapes across cancer samples to:
#>
#>  <ul style='margin-bottom: 5px;'>
#>  Identify Driver Mutations: Frequently mutated genes (e.g., TP53, KRAS)
#>  driving cancer progression
#>  Discover Therapeutic Targets: Actionable mutations for precision
#>  medicine and targeted therapy
#>  Analyze Mutation Patterns: Co-occurring vs mutually exclusive
#>  alterations indicating pathway dependencies
#>  Assess Tumor Mutation Burden (TMB): High TMB may predict immunotherapy
#>  response
#>  Stratify Patients: Group patients by molecular profiles for clinical
#>  trials
#>
#>
#>
#>  <div style='background-color: #fff3cd; border-left: 4px solid #f39c12;
#>  padding: 10px; margin: 10px 0;'>
#>  <h4 style='color: #e67e22; margin-top: 0;'> When to Use This Analysis
#>
#>  <ul style='margin-bottom: 5px;'>
#>  Tumor Profiling: Characterizing mutation landscapes in cancer cohorts
#>  Biomarker Discovery: Identifying prognostic or predictive molecular
#>  markers
#>  Clinical Trial Design: Patient stratification based on genomic
#>  profiles
#>  Pathway Analysis: Understanding oncogenic pathway alterations
#>  Therapeutic Planning: Matching patients to targeted therapies
#>
#>
#>
#>  <div style='background-color: #d4edda; border-left: 4px solid #28a745;
#>  padding: 10px; margin: 10px 0;'>
#>  <h4 style='color: #27ae60; margin-top: 0;'> Data Requirements
#>
#>  <ul style='margin-bottom: 5px;'>
#>  Sample ID: Patient/tumor identifiers (e.g., TCGA-AA-3818, P001)
#>  Gene Variables: Binary mutation status (0 = wild-type, 1 = mutated)
#>  Clinical Data: Age, stage, grade, treatment response (optional)
#>  Mutation Types: SNV, CNV, Indel classifications (optional)
#>
#>
#>
#>  <div style='background-color: #f8d7da; border-left: 4px solid #dc3545;
#>  padding: 10px; margin: 10px 0;'>
#>  <h4 style='color: #c0392b; margin-top: 0;'> Important Considerations
#>
#>  <ul style='margin-bottom: 5px;'>
#>  Sample Size: Minimum 10 samples recommended for meaningful patterns
#>  Data Quality: Ensure consistent mutation calling and annotation
#>  Clinical Context: Consider tumor type, stage, and treatment history
#>  Statistical Power: Larger cohorts needed for rare mutation analysis
#>
#>
#>
#>
#>
#>  <div style='padding: 15px; background-color: #f8f9fa; border-radius:
#>  8px; margin: 10px 0;'><p style='color: #28a745; margin: 5px 0;'>
#>  Sample ID Variable: SampleID selected
#>
#>  <p style='color: #28a745; margin: 5px 0;'> Gene Variables: 2 genes
#>  selected
#>
#>  <div style='background-color: #d4edda; padding: 10px; border-radius:
#>  4px; margin-top: 15px;'><h4 style='color: #155724; margin-top: 0;'>
#>  Ready for Analysis!
#>
#>  <p style='margin: 5px 0; color: #155724;'>Minimum requirements met.
#>  The oncoplot will appear below.
#>
#>  Mutation Summary
#>  ──────────────────────────────────────────────────────────────────────────────────────
#>    Gene    Mutated Samples    Total Samples    Mutation Frequency    Most Common Type
#>  ──────────────────────────────────────────────────────────────────────────────────────
#>    TP53                  5               10              50.00000    SNV
#>    KRAS                  5               10              50.00000    SNV
#>  ──────────────────────────────────────────────────────────────────────────────────────
#>
#>
#>  Per-sample Mutation Burden
#>  ──────────────────────────────────────────────────
#>    Sample ID    Total Mutations    Log10(TMB + 1)
#>  ──────────────────────────────────────────────────
#>  ──────────────────────────────────────────────────
#>
#>
#>  Plot Information
#>  ─────────────────────────────
#>    Parameter        Value
#>  ─────────────────────────────
#>    Total Samples    10
#>    Total Genes      2
#>    Plot Type        oncoplot
#>    Color Scheme     default
#>    Width            800
#>    Height           600
#>  ─────────────────────────────
#>
#>
#>  <div style='background-color: #f8f9fa; border-radius: 8px; padding:
#>  15px; margin: 15px 0;'>
#>  <h3 style='color: #2c3e50; margin-top: 0;'> Clinical Interpretation
#>
#>  <div style='background-color: #e8f4fd; border-left: 4px solid #3498db;
#>  padding: 10px; margin: 10px 0;'>
#>  <h4 style='color: #2980b9; margin-top: 0;'> Most Frequently Mutated
#>  Genes
#>
#>  <ul style='margin-bottom: 5px;'>
#>  TP53: 5/10 samples (50%) - Guardian of genome, tumor suppressor
#>  frequently mutated in cancer
#>  KRAS: 5/10 samples (50%) - Oncogene driving cell proliferation,
#>  therapeutic target in multiple cancers
#>
#>  <div style='background-color: #fff3cd; border-left: 4px solid #ffc107;
#>  padding: 10px; margin: 10px 0;'>
#>  <h4 style='color: #856404; margin-top: 0;'> Clinical Recommendations
#>
#>  Actionable mutations detected: KRAS
#>
#>  • Consider targeted therapy options and clinical trial eligibility
#>
#>  • Review FDA-approved drugs and companion diagnostics
#>
#>  Mutation co-occurrence analysis recommended:
#>
#>  • Use co-occurrence plot to identify mutually exclusive or concurrent
#>  mutations
#>
#>  • Consider pathway analysis for therapeutic strategy
#>
#>  <div style='background-color: #f3e5f5; border-left: 4px solid #9c27b0;
#>  padding: 10px; margin: 10px 0;'>
#>  <h4 style='color: #7b1fa2; margin-top: 0;'> Sample Stratification
#>  Insights
#>
#>  Sample size: 10 samples analyzed
#>
#>  Limited power - findings should be validated in larger cohorts
#>
#>  <div style='background-color: #f8f9fa; border: 1px solid #dee2e6;
#>  border-radius: 8px; padding: 20px; margin: 15px 0;'>
#>  <h3 style='color: #2c3e50; margin-top: 0; border-bottom: 2px solid
#>  #3498db; padding-bottom: 10px;'> Clinical Summary for Reports
#>
#>  <div style='background-color: white; padding: 15px; border-radius:
#>  5px; border-left: 4px solid #28a745;'>
#>  <p style='margin-bottom: 15px; font-weight: bold; color:
#>  #28a745;'>Copy-Ready Summary Text:
#>
#>  <div style='font-family: Georgia, serif; line-height: 1.6; padding:
#>  10px; background-color: #f8f9fa; border-radius: 3px;'>
#>
#>  Genomic Analysis Summary: Analysis of 10 samples revealed mutation
#>  frequencies in key cancer-associated genes. TP53 was mutated in 5
#>  samples (50%), KRAS was mutated in 5 samples (50%). Notably,
#>  actionable mutations were identified in KRAS, which may inform
#>  targeted therapy selection. These findings contribute to understanding
#>  the genomic landscape and may inform precision medicine approaches.
#>
#>  <div style='margin-top: 15px; padding: 10px; background-color:
#>  #e9ecef; border-radius: 3px;'>
#>  <p style='margin: 0; font-size: 0.9em; color: #6c757d;'>Methods Note:
#>  Genomic landscape visualization was performed using oncoplot analysis
#>  with mutation matrix visualization. Analysis included 2 genes across
#>  10 samples.