A longitudinal dataset containing eGFR measurements and end-stage renal disease (ESRD) or death outcomes for 150 chronic kidney disease patients.
Format
A data frame with 1573 observations and 9 variables:
- patient_id
Character. Unique patient identifier (CKD_001 to CKD_150)
- age
Numeric. Patient age at baseline (years)
- diabetes
Factor. Diabetes status (No, Yes)
- hypertension
Factor. Hypertension status (No, Yes)
- baseline_proteinuria
Numeric. Baseline proteinuria (g/day)
- visit_time
Numeric. Time of eGFR measurement (months from baseline)
- egfr
Numeric. Estimated glomerular filtration rate (mL/min/1.73m^2)
- survival_time
Numeric. Time to ESRD/death or last follow-up (months)
- esrd_death_status
Numeric. Event indicator (0 = censored, 1 = ESRD, 2 = death)
Details
The dataset simulates chronic kidney disease progression where:
eGFR generally declines over time
Diabetes and hypertension accelerate decline
Lower eGFR increases hazard of ESRD or death
Competing risks: ESRD vs death
14.7% event rate over 72 months follow-up
Examples
data(kidney_joint_data)
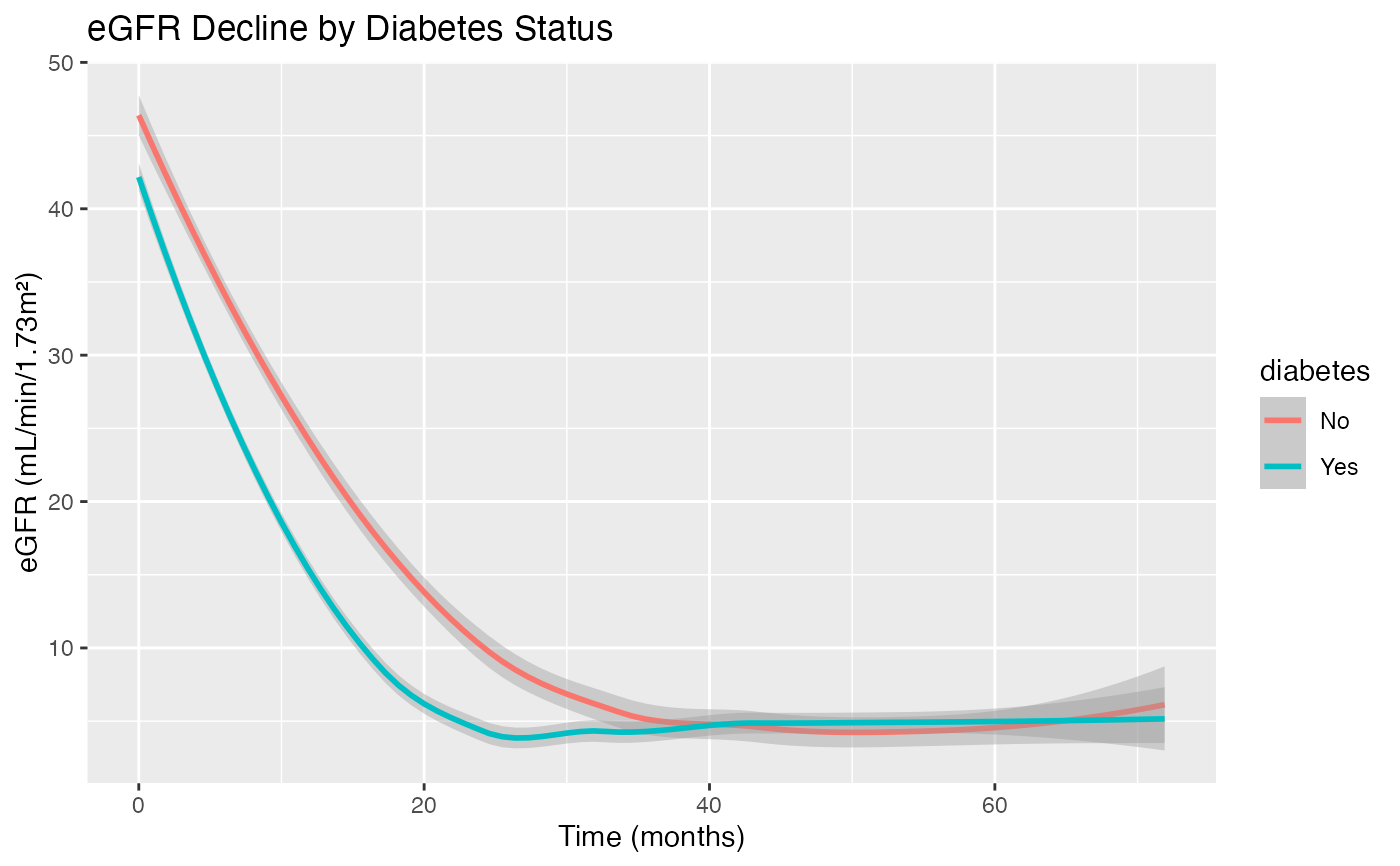
# eGFR trajectories by diabetes status
library(ggplot2)
ggplot(kidney_joint_data, aes(x = visit_time, y = egfr, color = diabetes)) +
geom_smooth(method = "loess") +
labs(title = "eGFR Decline by Diabetes Status",
x = "Time (months)", y = "eGFR (mL/min/1.73m^2)")
#> `geom_smooth()` using formula = 'y ~ x'