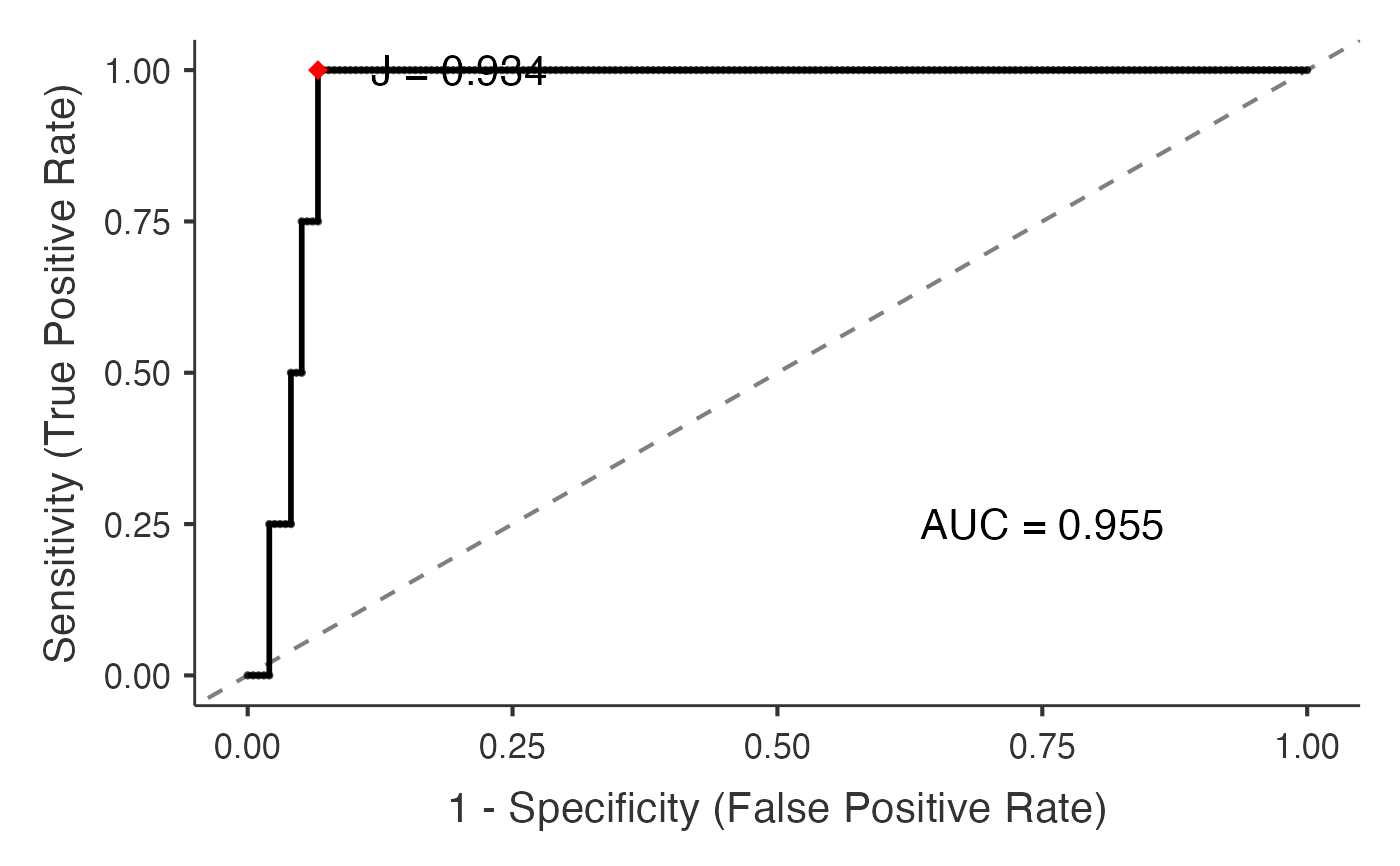
Dataset with 200 patients and severe class imbalance (2% event rate), representing extremely rare outcomes where PPV/NPV are critical metrics.
Format
A data frame with 200 rows and 3 variables:
- patient_id
Character: Patient identifier (PT001-PT200)
- rare_outcome
Factor: "Event" or "No_Event" (2%/98% prevalence)
- predictor
Numeric: Predictor value (mean: 90 for event, 50 for no event)
Details
Extreme class imbalance (2% events) with good predictor discrimination. Tests handling of severely imbalanced data and emphasis on predictive values over sensitivity/specificity.
Examples
data(psychopdaROC_imbalanced)
psychopdaROC(data = psychopdaROC_imbalanced, dependentVars = "predictor",
             classVar = "rare_outcome", positiveClass = "Event",
             refVar = "predictor")
#>
#>  ADVANCED ROC ANALYSIS
#>
#>
#>
#>
#>  Procedure Notes
#>
#>
#>
#>  The ROC analysis has been completed using the following
#>  specifications:
#>
#>
#>
#>  Measure Variable(s): predictor
#>
#>  Class Variable: rare_outcome
#>
#>  Positive Class: Event
#>
#>
#>
#>  Method: maximize_metric
#>
#>  All Observed Cutpoints: FALSE
#>
#>  Metric: youden
#>
#>  Direction (relative to cutpoint): >=
#>
#>  Tie Breakers: mean
#>
#>  Metric Tolerance: 1e-06
#>
#>
#>
#>  <hr />
#>
#>  <div style='padding: 10px; background-color: #f8f9fa; border: 1px
#>  solid #dee2e6; border-radius: 4px; margin-bottom: 15px;'>
#>
#>  Analysis Status
#>
#>  Seed: 123Positive Class: Event (Prevalence: 2%)Analysis Mode:
#>  Basic<div style='background-color: #fff3cd; color: #856404; padding:
#>  10px; border-radius: 4px; margin-top: 10px;'>Warnings:Class imbalance
#>  detected (Prevalence: 2.0%). Consider using Precision-Recall curves.
#>
#>  ROC Analysis Summary
#>  ────────────────────────────────────────────────────────────────────────
#>    Variable     AUC          95% CI Lower    95% CI Upper    p-value
#>  ────────────────────────────────────────────────────────────────────────
#>    predictor    0.9553571       0.9235097       0.9872046    < .0000001
#>  ────────────────────────────────────────────────────────────────────────
#>    Note. Reading of the test values: <b>HIGHER values were taken to
#>    indicate Event</b> (Classification Direction = ">="). If that is
#>    the wrong way round for this marker, every sensitivity,
#>    specificity, cutpoint and AUC below is reversed — switch
#>    Classification Direction to "<=" and the AUC becomes 1 minus the
#>    value shown.
#>    Note. AUC 95% confidence intervals computed using the DeLong
#>    method.
#>
#>
#>  Clinical Interpretation
#>  ────────────────────────────────────────────────────────────────────────────────────────────────────────────────────────────────────────────────────────────────────────────────────────────────────────────────────────────────────────────────────────────
#>    Test         Performance Level    Clinical Recommendation                                Detailed Interpretation
#>  ────────────────────────────────────────────────────────────────────────────────────────────────────────────────────────────────────────────────────────────────────────────────────────────────────────────────────────────────────────────────────────────
#>    predictor    Excellent            Suitable for clinical use with appropriate cutpoint    The test 'predictor' has an AUC of 0.955 indicating excellent discriminatory ability. This test can reliably distinguish between diseased and healthy patients.
#>  ────────────────────────────────────────────────────────────────────────────────────────────────────────────────────────────────────────────────────────────────────────────────────────────────────────────────────────────────────────────────────────────
#>
#>
#>  OPTIMAL CUTPOINTS AND PERFORMANCE
#>
#>  no title
#>  ─────────────────────────────────────────────────────────────────────────────────────────────────────────────────
#>    Cutpoint      Sensitivity    Specificity    PPV          NPV          Youden's J    AUC          Metric Score
#>  ─────────────────────────────────────────────────────────────────────────────────────────────────────────────────
#>    76.9122686      100.00000       93.36735     23.52941    100.00000     0.9336735    0.9553571       0.9336735
#>  ─────────────────────────────────────────────────────────────────────────────────────────────────────────────────
#>
#>
#>  Area Under the ROC Curve
#>  ────────────────────────────────────────────────────────────────────────
#>    Variable     AUC          95% CI Lower    95% CI Upper    p-value
#>  ────────────────────────────────────────────────────────────────────────
#>    predictor    0.9553571       0.9235097       0.9872046    < .0000001
#>  ────────────────────────────────────────────────────────────────────────
#>    Note. Reading of the test values: <b>HIGHER values were taken to
#>    indicate Event</b> (Classification Direction = ">="). If that is
#>    the wrong way round for this marker, every sensitivity,
#>    specificity, cutpoint and AUC below is reversed — switch
#>    Classification Direction to "<=" and the AUC becomes 1 minus the
#>    value shown.
#>    Note. AUC 95% confidence intervals computed using the DeLong
#>    method.
#>