Dataset with 150 patients including missing values in predictors and class variable for testing handling of incomplete data.
Format
A data frame with 150 rows and 5 variables:
- patient_id
Character: Patient identifier (PT001-PT150)
- diagnosis
Factor: "Disease" or "Healthy" with ~5% missing
- test_a
Numeric: First test with ~8% missing
- test_b
Numeric: Second test with ~7% missing
- covariate
Factor: "A", "B", or "C"
Details
Missing data introduced randomly: diagnosis (8 missing), test_a (12 missing), test_b (10 missing). Tests proper handling of missing values in ROC analysis with appropriate warnings or exclusions.
Examples
data(psychopdaROC_missing)
psychopdaROC(data = psychopdaROC_missing,
             dependentVars = c("test_a", "test_b"),
             classVar = "diagnosis", positiveClass = "Disease",
             refVar = "test_a")
#>
#>  ADVANCED ROC ANALYSIS
#>
#>
#>
#>
#>  Procedure Notes
#>
#>
#>
#>  The ROC analysis has been completed using the following
#>  specifications:
#>
#>
#>
#>  Measure Variable(s): test_a, test_b
#>
#>  Class Variable: diagnosis
#>
#>  Positive Class: Disease
#>
#>
#>
#>  Method: maximize_metric
#>
#>  All Observed Cutpoints: FALSE
#>
#>  Metric: youden
#>
#>  Direction (relative to cutpoint): >=
#>
#>  Tie Breakers: mean
#>
#>  Metric Tolerance: 1e-06
#>
#>
#>
#>  <hr />
#>
#>  <div style='padding: 10px; background-color: #f8f9fa; border: 1px
#>  solid #dee2e6; border-radius: 4px; margin-bottom: 15px;'>
#>
#>  Analysis Status
#>
#>  Seed: 123Positive Class: Disease (Prevalence: 50.7%)Analysis Mode:
#>  Basic
#>
#>  ROC Analysis Summary
#>  ──────────────────────────────────────────────────────────────────────
#>    Variable    AUC          95% CI Lower    95% CI Upper    p-value
#>  ──────────────────────────────────────────────────────────────────────
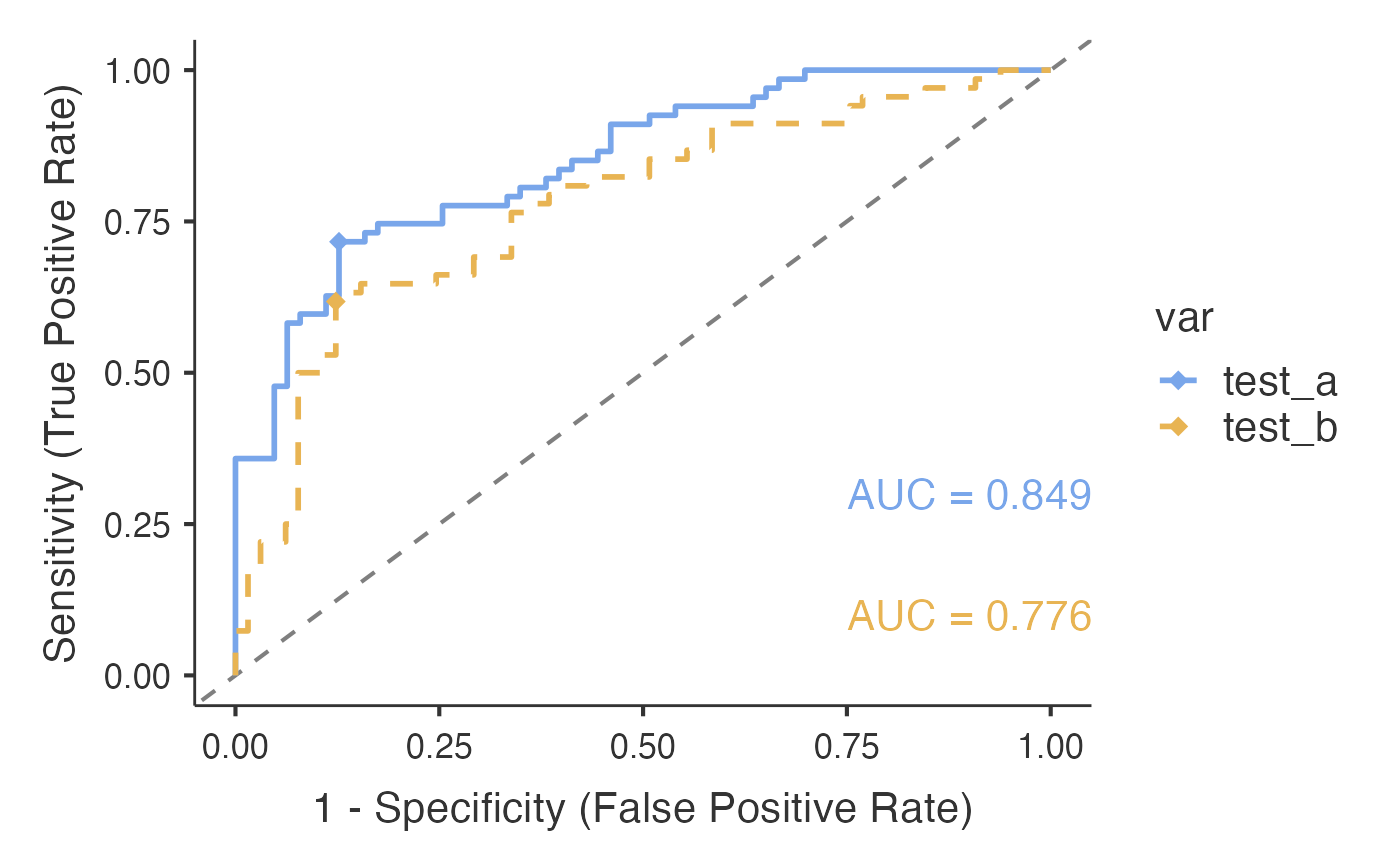
#>    test_a      0.8488510
#>    test_b      0.7755656
#>  ──────────────────────────────────────────────────────────────────────
#>    Note. Reading of the test values: <b>HIGHER values were taken to
#>    indicate Disease</b> (Classification Direction = ">="). If that
#>    is the wrong way round for this marker, every sensitivity,
#>    specificity, cutpoint and AUC below is reversed — switch
#>    Classification Direction to "<=" and the AUC becomes 1 minus the
#>    value shown.
#>
#>
#>  Clinical Interpretation
#>  ─────────────────────────────────────────────────────────────────────────────────────────────────────────────────────────────────────────────────────────────────────────────────────────────────────────────────────────────
#>    Test      Performance Level    Clinical Recommendation                                Detailed Interpretation
#>  ─────────────────────────────────────────────────────────────────────────────────────────────────────────────────────────────────────────────────────────────────────────────────────────────────────────────────────────────
#>    test_a    Good                 Suitable for clinical use with appropriate cutpoint    The test 'test_a' has an AUC of 0.849 indicating good discriminatory ability. This test performs well for clinical decision making.
#>    test_b    Fair                 May be useful in combination with other markers        The test 'test_b' has an AUC of 0.776 indicating fair discriminatory ability. Consider combining with other clinical information.
#>  ─────────────────────────────────────────────────────────────────────────────────────────────────────────────────────────────────────────────────────────────────────────────────────────────────────────────────────────────
#>
#>
#>  OPTIMAL CUTPOINTS AND PERFORMANCE
#>
#>  no title
#>  ─────────────────────────────────────────────────────────────────────────────────────────────────────────────────
#>    Cutpoint      Sensitivity    Specificity    PPV          NPV          Youden's J    AUC          Metric Score
#>  ─────────────────────────────────────────────────────────────────────────────────────────────────────────────────
#>    59.8074173       71.64179       87.30159     85.71429     74.32432     0.5894338    0.8488510       0.5894338
#>  ─────────────────────────────────────────────────────────────────────────────────────────────────────────────────
#>
#>
#>  no title
#>  ─────────────────────────────────────────────────────────────────────────────────────────────────────────────────
#>    Cutpoint      Sensitivity    Specificity    PPV          NPV          Youden's J    AUC          Metric Score
#>  ─────────────────────────────────────────────────────────────────────────────────────────────────────────────────
#>    61.9134099       61.76471       87.69231     84.00000     68.67470     0.4945701    0.7755656       0.4945701
#>  ─────────────────────────────────────────────────────────────────────────────────────────────────────────────────
#>
#>
#>  Area Under the ROC Curve
#>  ──────────────────────────────────────────────────────────────────────
#>    Variable    AUC          95% CI Lower    95% CI Upper    p-value
#>  ──────────────────────────────────────────────────────────────────────
#>    test_a      0.8488510
#>    test_b      0.7755656
#>  ──────────────────────────────────────────────────────────────────────
#>    Note. Reading of the test values: <b>HIGHER values were taken to
#>    indicate Disease</b> (Classification Direction = ">="). If that
#>    is the wrong way round for this marker, every sensitivity,
#>    specificity, cutpoint and AUC below is reversed — switch
#>    Classification Direction to "<=" and the AUC becomes 1 minus the
#>    value shown.
#>