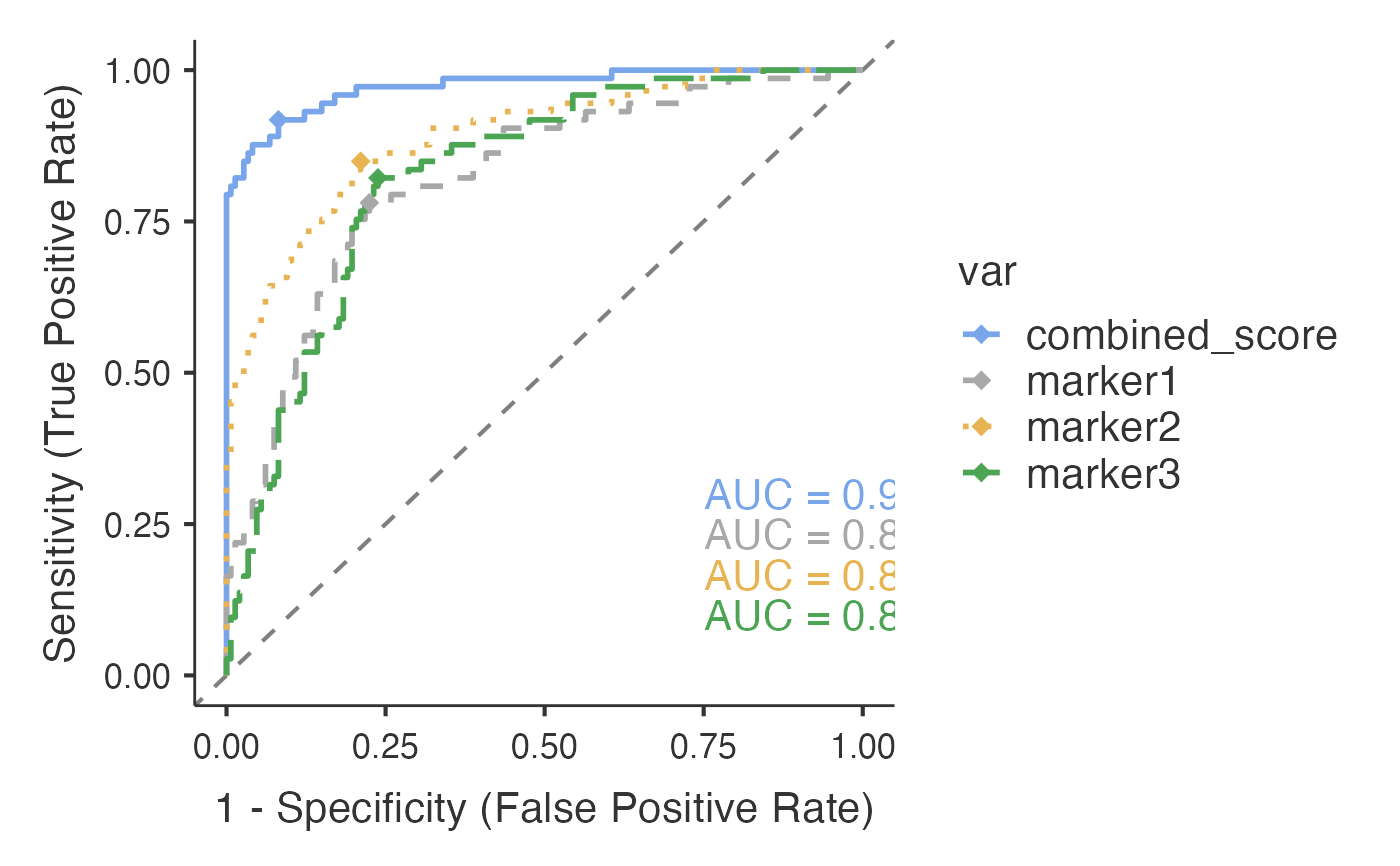
Multiple biomarker comparison dataset with 220 patients featuring three individual markers and a combined score for ROC analysis and marker comparison.
Format
A data frame with 220 rows and 6 variables:
- patient_id
Character: Patient identifier (PT001-PT220)
- diagnosis
Factor: "Positive" or "Negative" (35%/65% prevalence)
- marker1
Numeric: First biomarker (mean: 100 for positive, 70 for negative)
- marker2
Numeric: Second biomarker (mean: 85 for positive, 55 for negative)
- marker3
Numeric: Third biomarker (mean: 90 for positive, 65 for negative)
- combined_score
Numeric: Average of three markers
Details
Designed for comparing individual biomarker performance and evaluating combined marker strategies. The combined score typically shows improved discrimination compared to individual markers.
Examples
data(psychopdaROC_multibiomarker)
psychopdaROC(data = psychopdaROC_multibiomarker,
             dependentVars = c("marker1", "marker2", "marker3", "combined_score"),
             classVar = "diagnosis", positiveClass = "Positive",
             refVar = "marker1",
             clinicalMode = "comprehensive")
#>
#>  ADVANCED ROC ANALYSIS
#>
#>
#>
#>
#>  Procedure Notes
#>
#>
#>
#>  The ROC analysis has been completed using the following
#>  specifications:
#>
#>
#>
#>  Measure Variable(s): marker1, marker2, marker3, combined_score
#>
#>  Class Variable: diagnosis
#>
#>  Positive Class: Positive
#>
#>
#>
#>  Method: maximize_metric
#>
#>  All Observed Cutpoints: FALSE
#>
#>  Metric: youden
#>
#>  Direction (relative to cutpoint): >=
#>
#>  Tie Breakers: mean
#>
#>  Metric Tolerance: 1e-06
#>
#>
#>
#>  <hr />
#>
#>  <div style='padding: 10px; background-color: #f8f9fa; border: 1px
#>  solid #dee2e6; border-radius: 4px; margin-bottom: 15px;'>
#>
#>  Analysis Status
#>
#>  Seed: 123Positive Class: Positive (Prevalence: 33.2%)Analysis Mode:
#>  Comprehensive
#>
#>  ROC Analysis Summary
#>  ─────────────────────────────────────────────────────────────────────────────
#>    Variable          AUC          95% CI Lower    95% CI Upper    p-value
#>  ─────────────────────────────────────────────────────────────────────────────
#>    marker1           0.8214519       0.7624193       0.8804845    < .0000001
#>    marker2           0.8895723       0.8429232       0.9362213    < .0000001
#>    marker3           0.8276023       0.7722325       0.8829720    < .0000001
#>    combined_score    0.9729755       0.9516340       0.9943170    < .0000001
#>  ─────────────────────────────────────────────────────────────────────────────
#>    Note. Reading of the test values: <b>HIGHER values were taken to
#>    indicate Positive</b> (Classification Direction = ">="). If that is the
#>    wrong way round for this marker, every sensitivity, specificity,
#>    cutpoint and AUC below is reversed — switch Classification Direction to
#>    "<=" and the AUC becomes 1 minus the value shown.
#>    Note. AUC 95% confidence intervals computed using the DeLong method.
#>
#>
#>  Clinical Interpretation
#>  ──────────────────────────────────────────────────────────────────────────────────────────────────────────────────────────────────────────────────────────────────────────────────────────────────────────────────────────────────────────────────────────────────────
#>    Test              Performance Level    Clinical Recommendation                                Detailed Interpretation
#>  ──────────────────────────────────────────────────────────────────────────────────────────────────────────────────────────────────────────────────────────────────────────────────────────────────────────────────────────────────────────────────────────────────────
#>    marker1           Good                 Suitable for clinical use with appropriate cutpoint    The test 'marker1' has an AUC of 0.821 indicating good discriminatory ability. This test performs well for clinical decision making.
#>    marker2           Good                 Suitable for clinical use with appropriate cutpoint    The test 'marker2' has an AUC of 0.890 indicating good discriminatory ability. This test performs well for clinical decision making.
#>    marker3           Good                 Suitable for clinical use with appropriate cutpoint    The test 'marker3' has an AUC of 0.828 indicating good discriminatory ability. This test performs well for clinical decision making.
#>    combined_score    Excellent            Suitable for clinical use with appropriate cutpoint    The test 'combined_score' has an AUC of 0.973 indicating excellent discriminatory ability. This test can reliably distinguish between diseased and healthy patients.
#>  ──────────────────────────────────────────────────────────────────────────────────────────────────────────────────────────────────────────────────────────────────────────────────────────────────────────────────────────────────────────────────────────────────────
#>
#>
#>  OPTIMAL CUTPOINTS AND PERFORMANCE
#>
#>  no title
#>  ─────────────────────────────────────────────────────────────────────────────────────────────────────────────────
#>    Cutpoint      Sensitivity    Specificity    PPV          NPV          Youden's J    AUC          Metric Score
#>  ─────────────────────────────────────────────────────────────────────────────────────────────────────────────────
#>    87.2430392       78.08219       77.55102     63.33333     87.69231     0.5563321    0.8214519       0.5563321
#>  ─────────────────────────────────────────────────────────────────────────────────────────────────────────────────
#>
#>
#>  no title
#>  ─────────────────────────────────────────────────────────────────────────────────────────────────────────────────
#>    Cutpoint      Sensitivity    Specificity    PPV          NPV          Youden's J    AUC          Metric Score
#>  ─────────────────────────────────────────────────────────────────────────────────────────────────────────────────
#>    70.1905619       84.93151       78.91156     66.66667     91.33858     0.6384307    0.8895723       0.6384307
#>  ─────────────────────────────────────────────────────────────────────────────────────────────────────────────────
#>
#>
#>  no title
#>  ─────────────────────────────────────────────────────────────────────────────────────────────────────────────────
#>    Cutpoint      Sensitivity    Specificity    PPV          NPV          Youden's J    AUC          Metric Score
#>  ─────────────────────────────────────────────────────────────────────────────────────────────────────────────────
#>    76.2878694       82.19178       76.19048     63.15789     89.60000     0.5838226    0.8276023       0.5838226
#>  ─────────────────────────────────────────────────────────────────────────────────────────────────────────────────
#>
#>
#>  no title
#>  ─────────────────────────────────────────────────────────────────────────────────────────────────────────────────
#>    Cutpoint      Sensitivity    Specificity    PPV          NPV          Youden's J    AUC          Metric Score
#>  ─────────────────────────────────────────────────────────────────────────────────────────────────────────────────
#>    76.7601567       91.78082       91.83673     84.81013     95.74468     0.8361756    0.9729755       0.8361756
#>  ─────────────────────────────────────────────────────────────────────────────────────────────────────────────────
#>
#>
#>  Area Under the ROC Curve
#>  ─────────────────────────────────────────────────────────────────────────────
#>    Variable          AUC          95% CI Lower    95% CI Upper    p-value
#>  ─────────────────────────────────────────────────────────────────────────────
#>    marker1           0.8214519       0.7624193       0.8804845    < .0000001
#>    marker2           0.8895723       0.8429232       0.9362213    < .0000001
#>    marker3           0.8276023       0.7722325       0.8829720    < .0000001
#>    combined_score    0.9729755       0.9516340       0.9943170    < .0000001
#>  ─────────────────────────────────────────────────────────────────────────────
#>    Note. Reading of the test values: <b>HIGHER values were taken to
#>    indicate Positive</b> (Classification Direction = ">="). If that is the
#>    wrong way round for this marker, every sensitivity, specificity,
#>    cutpoint and AUC below is reversed — switch Classification Direction to
#>    "<=" and the AUC becomes 1 minus the value shown.
#>    Note. AUC 95% confidence intervals computed using the DeLong method.
#>