Example Vessel Density Data for Stereology Analysis
Source:R/stereology_vessel_data_documentation.R
stereology_vessel_data.RdSimulated dataset of vessel density measurements using stereology methods in tissue samples from patients with different diagnoses. This dataset demonstrates quantitative histopathology using systematic grid-based sampling.
Format
A data frame with 50 observations and 13 variables:
- image_id
Character. Unique image identifier
- diagnosis
Factor. Diagnosis group (Normal, Benign, Malignant)
- tissue_type
Character. Type of structure quantified (Blood Vessels)
- intersections
Integer. Number of grid intersections with vessels
- total_points
Integer. Total number of grid points examined (100)
- boundary_intersections
Integer. Grid line intersections with vessel boundaries
- object_count
Integer. Number of discrete vessels counted
- reference_area
Numeric. Total reference area examined (um^2)
- grid_spacing
Numeric. Distance between grid lines (um)
- section_thickness
Numeric. Histological section thickness (um)
- Aa
Numeric. Calculated area density (fraction)
- Vv
Numeric. Calculated volume density (fraction)
Source
Simulated data based on stereology principles from: Kayser et al. (2009) Diagnostic Pathology 4:6. Realistic vessel density values based on published tumor angiogenesis studies.
Details
Study Design:
50 histological images from 3 diagnostic groups
Systematic 10x10 grid overlay (100 points per image)
Grid spacing: 10 um
Reference area: 1000x1000 um (1 mm^2)
Section thickness: 5 um (standard histology)
Clinical Context: Vessel density is a critical parameter in tumor pathology. Malignant tumors often show increased angiogenesis (new blood vessel formation) to support rapid growth. Stereology provides unbiased quantification of vessel density from 2D histological sections without requiring 3D reconstruction.
Vessel Density by Diagnosis:
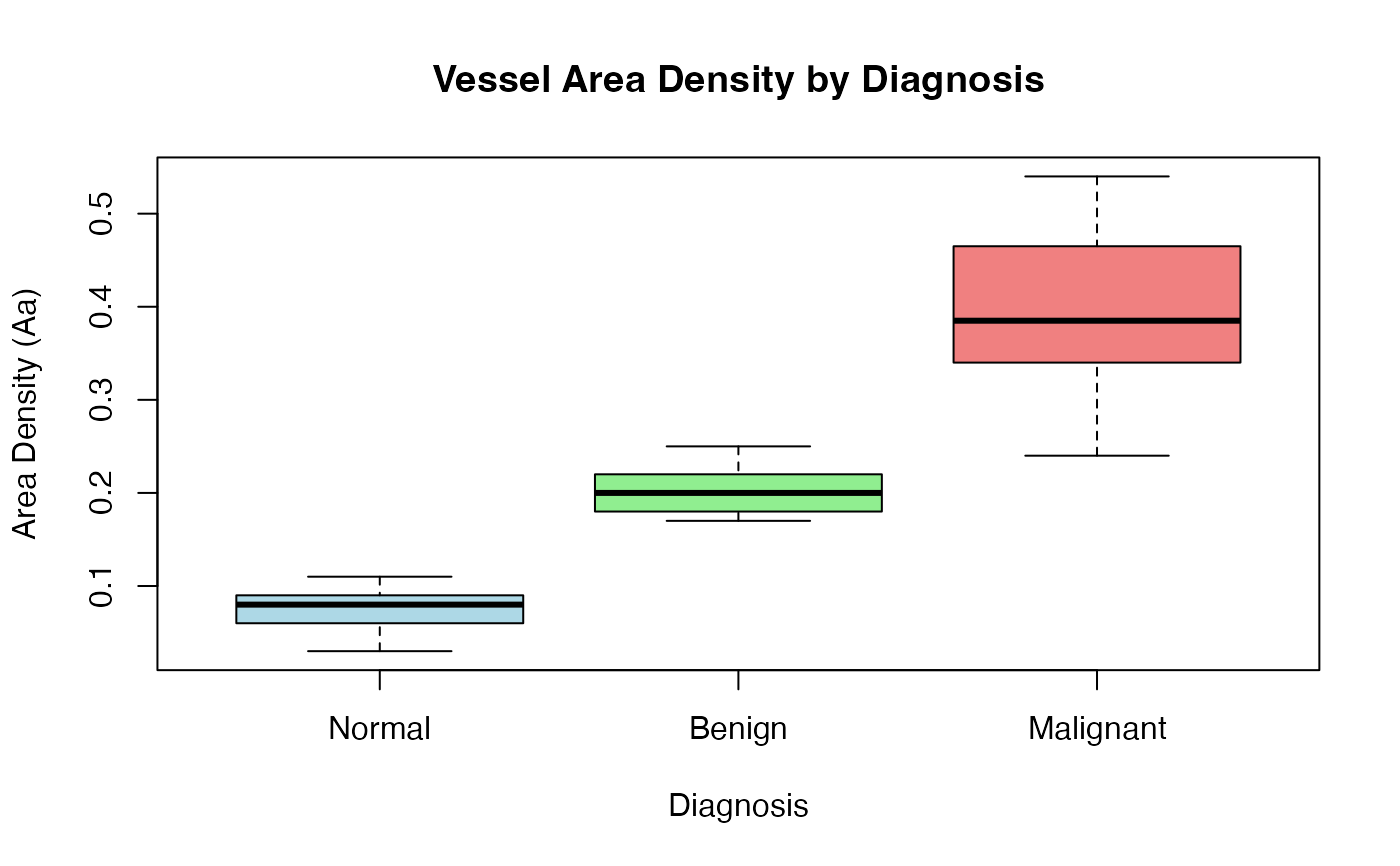
Normal tissue: Low vessel density (Aa ~ 0.05-0.10)
Benign tumors: Moderate vessel density (Aa ~ 0.15-0.25)
Malignant tumors: High vessel density (Aa ~ 0.30-0.50) due to angiogenesis
Stereological Parameters:
Area Density (Aa)
Formula: Aa = intersections / total_points
Meaning: Fraction of tissue area occupied by vessels
Use: Primary measure of vessel density
Volume Density (Vv)
Formula: Vv = Aa (for isotropic random sections)
Meaning: Fraction of tissue volume occupied by vessels
Use: 3D estimate from 2D sections
Boundary Density (Ba)
Formula: Ba = (2 x boundary_intersections) / line_length
Meaning: Vessel boundary length per unit area
Use: Measure of vessel complexity
Numerical Density (Na)
Formula: Na = object_count / reference_area
Meaning: Number of vessels per unit area
Use: Vessel count density
Surface Density (Sv)
Formula: Sv = 2 x Ba
Meaning: Vessel surface area per unit volume
Use: Exchange surface quantification
Example Analysis:
# Load data
data(stereology_vessel_data, package = "ClinicoPath")

# Basic stereology analysis
stereology(
  data = stereology_vessel_data,
  intersections = 'intersections',
  totalPoints = 'total_points',
  referenceArea = 'reference_area',
  gridSpacing = 'grid_spacing',
  calculateAa = TRUE,
  calculateVv = TRUE,
  showConfidenceIntervals = TRUE
)

# Group comparison by diagnosis
stereology(
  data = stereology_vessel_data,
  intersections = 'intersections',
  totalPoints = 'total_points',
  referenceArea = 'reference_area',
  gridSpacing = 'grid_spacing',
  groupVar = 'diagnosis',
  showGroupComparison = TRUE
)

# Advanced analysis with all parameters
stereology(
  data = stereology_vessel_data,
  intersections = 'intersections',
  totalPoints = 'total_points',
  boundaryIntersections = 'boundary_intersections',
  objectCount = 'object_count',
  referenceArea = 'reference_area',
  gridSpacing = 'grid_spacing',
  tissueType = 'vessels',
  calculateAa = TRUE,
  calculateVv = TRUE,
  calculateBa = TRUE,
  calculateNa = TRUE,
  calculateSv = TRUE,
  showConfidenceIntervals = TRUE,
  bootstrapIterations = 1000
)
Why Stereology is Needed:
Provides unbiased estimates of 3D parameters from 2D sections
No need for complex 3D reconstruction
Well-established statistical properties
Reproducible across laboratories
Applicable to any histological structure
Expected Results:
Malignant tumors show significantly higher vessel density (Aa ~ 0.39)
Benign tumors have intermediate density (Aa ~ 0.20)
Normal tissue has lowest density (Aa ~ 0.07)
Statistical tests should show significant differences between groups
Quality Control:
Grid spacing appropriate for vessel size (10 um)
Adequate number of points per image (100 points)
Multiple images per diagnosis (16-17 per group)
Systematic random sampling approach
See also
stereology()for stereology analysis functionKayser et al. (2009) for theoretical framework
Gundersen & Jensen (1985, 1986) for stereology methodology
Examples
# \donttest{
# Load data
data(stereology_vessel_data, package = "ClinicoPath")

# Summary by diagnosis
aggregate(Aa ~ diagnosis, data = stereology_vessel_data,
          FUN = function(x) c(mean = mean(x), sd = sd(x)))
#>   diagnosis    Aa.mean      Aa.sd
#> 1    Normal 0.07352941 0.02422323
#> 2    Benign 0.20411765 0.02693947
#> 3 Malignant 0.39375000 0.08754999

# Visualize vessel density distribution
boxplot(Aa ~ diagnosis, data = stereology_vessel_data,
        main = "Vessel Area Density by Diagnosis",
        xlab = "Diagnosis", ylab = "Area Density (Aa)",
        col = c("lightblue", "lightgreen", "lightcoral"))


# Test for differences
summary(aov(Aa ~ diagnosis, data = stereology_vessel_data))
#>             Df Sum Sq Mean Sq F value Pr(>F)
#> diagnosis    2  0.852  0.4260   147.3 <2e-16 ***
#> Residuals   47  0.136  0.0029
#> ---
#> Signif. codes:  0 ‘***’ 0.001 ‘**’ 0.01 ‘*’ 0.05 ‘.’ 0.1 ‘ ’ 1
# }
# Test for differences
summary(aov(Aa ~ diagnosis, data = stereology_vessel_data))
#> Df Sum Sq Mean Sq F value Pr(>F)
#> diagnosis 2 0.852 0.4260 147.3 <2e-16 ***
#> Residuals 47 0.136 0.0029
#> ---
#> Signif. codes: 0 ‘***’ 0.001 ‘**’ 0.01 ‘*’ 0.05 ‘.’ 0.1 ‘ ’ 1
# }