Cure Models for Long-Term Survivors - Comprehensive Guide
Source:vignettes/oncopath-curemodels-comprehensive.Rmd
oncopath-curemodels-comprehensive.RmdNote: The
curemodels()function is designed for use within jamovi’s GUI. The code examples below show the R syntax for reference. To run interactively, usedevtools::load_all()and call the R6 class directly:curemodelsClass$new(options = curemodelsOptions$new(...), data = mydata).
Cure Models for Long-Term Survivors
Overview
In many solid tumours, a proportion of patients experience long-term disease-free survival that is effectively indistinguishable from the general population. Standard survival models (Cox, Kaplan-Meier) assume every patient will eventually experience the event, which misrepresents prognosis for cancers with a curable subset. Cure models address this by partitioning the population into two groups: patients who are statistically cured and patients who remain at risk (uncured). This yields two clinically actionable quantities: the cure fraction (probability of long-term cure) and the latency distribution (survival among uncured patients).
The curemodels module provides four complementary
modelling frameworks:
| Model | R Package | Approach | Best For |
|---|---|---|---|
| Mixture cure | smcure |
Separate logistic (cure) + survival (latency) | Standard clinical cure rate estimation |
| Non-mixture cure | flexsurvcure |
Cure fraction embedded in parametric survival | Parametric model comparison across distributions |
| Background-mortality cure | cuRe |
Excess hazard above population mortality | Long follow-up where background mortality matters |
| Nonparametric cure | npcure |
Kernel smoothing, no distributional assumptions | Exploratory analysis without parametric constraints |
Dataset
data("curemodels_test")
str(curemodels_test)
#> 'data.frame':    250 obs. of  11 variables:
#>  $ PatientID        : chr  "CM-0001" "CM-0002" "CM-0003" "CM-0004" ...
#>  $ FollowUpMonths   : num  70.3 19.6 2.8 8.3 42 ...
#>  $ Recurrence       : int  0 0 1 1 0 0 0 1 0 1 ...
#>  $ RecurrenceFactor : Factor w/ 2 levels "Censored","Recurrence": 1 1 2 2 1 1 1 2 1 2 ...
#>  $ Age              : num  68 50 64 61 55 35 NA 51 63 57 ...
#>  $ Sex              : Factor w/ 2 levels "Female","Male": 2 1 1 2 2 2 2 1 1 1 ...
#>  $ Treatment        : Factor w/ 2 levels "Surgery Only",..: 2 2 1 2 2 2 2 2 1 2 ...
#>  $ Stage            : Factor w/ 3 levels "I","II","III": 1 3 3 3 2 1 1 3 3 2 ...
#>  $ TumorSize        : num  5.4 3.3 4.2 4.2 2.8 1.2 2.5 3.7 3.7 1.4 ...
#>  $ PerformanceStatus: int  0 1 1 0 1 1 1 1 0 2 ...
#>  $ BackgroundHazard : num  0.000964 0.000207 0.000633 0.00055 0.000341 0.000069 0.000314 0.000224 0.000584 0.000362 ...
summary(curemodels_test[, c("FollowUpMonths", "Recurrence", "Age",
                             "Treatment", "Stage", "TumorSize")])
#>  FollowUpMonths     Recurrence         Age                   Treatment
#>  Min.   :  0.60   Min.   :0.000   Min.   :35.00   Surgery Only    :110
#>  1st Qu.: 10.03   1st Qu.:0.000   1st Qu.:55.00   Surgery+Adjuvant:140
#>  Median : 19.95   Median :1.000   Median :62.00
#>  Mean   : 32.71   Mean   :0.692   Mean   :62.36
#>  3rd Qu.: 50.33   3rd Qu.:1.000   3rd Qu.:69.00
#>  Max.   :110.50   Max.   :1.000   Max.   :85.00
#>                                   NAs    :8
#>  Stage      TumorSize
#>  I  :70   Min.   :0.500
#>  II :93   1st Qu.:2.400
#>  III:87   Median :3.400
#>           Mean   :3.444
#>           3rd Qu.:4.200
#>           Max.   :8.600
#> NAs :5| Variable | Type | Description |
|---|---|---|
| PatientID | Integer | Unique patient identifier |
| FollowUpMonths | Numeric | Follow-up time in months |
| Recurrence | Numeric (0/1) | Event indicator: 0=censored, 1=recurrence |
| RecurrenceFactor | Factor | Factor version of Recurrence |
| Age | Numeric | Patient age at diagnosis |
| Sex | Factor | Male / Female |
| Treatment | Factor | Surgery Only / Surgery+Adjuvant |
| Stage | Factor | I / II / III |
| TumorSize | Numeric | Tumor size in cm |
| PerformanceStatus | Integer | ECOG PS: 0, 1, or 2 |
| BackgroundHazard | Numeric | Expected population hazard rate |
cat("Total patients:", nrow(curemodels_test), "\n")
#> Total patients: 250
cat("Events (recurrences):", sum(curemodels_test$Recurrence == 1), "\n")
#> Events (recurrences): 173
cat("Censored:", sum(curemodels_test$Recurrence == 0), "\n")
#> Censored: 77
cat("Event rate:", round(mean(curemodels_test$Recurrence) * 100, 1), "%\n")
#> Event rate: 69.2 %
table(curemodels_test$Treatment)
#>
#>     Surgery Only Surgery+Adjuvant
#>              110              140
table(curemodels_test$Stage)
#>
#>   I  II III
#>  70  93  87
1. Package Availability Check
The cure models depend on several specialised R packages. Before running the examples, verify they are available.
required_pkgs <- c("smcure", "flexsurvcure", "cuRe", "npcure")
available <- sapply(required_pkgs, function(pkg) {
  requireNamespace(pkg, quietly = TRUE)
})
cat("Package availability:\n")
#> Package availability:
for (i in seq_along(required_pkgs)) {
  cat(sprintf("  %s: %s\n", required_pkgs[i],
              ifelse(available[i], "installed", "NOT FOUND")))
}
#>   smcure: installed
#>   flexsurvcure: NOT FOUND
#>   cuRe: NOT FOUND
#>   npcure: NOT FOUND
2. Mixture Cure Model (smcure)
2.1 Basic Mixture Cure Model
The simplest case: estimate the overall cure fraction without covariates. The mixture cure model decomposes the survival function as:
S(t) = pi + (1 - pi) * S_u(t)
where pi is the cure fraction and S_u(t) is the survival function of uncured patients.
curemodels(
  data = curemodels_test,
  time = "FollowUpMonths",
  status = "Recurrence",
  model_type = "mixture"
)
#> Error in `curemodels()`:
#> ! argument "predictors" is missing, with no default
2.2 Mixture Cure Model with Predictors (PH)
Adding covariates allows estimation of how treatment and stage affect both the probability of cure (incidence component) and survival among uncured patients (latency component).
curemodels(
  data = curemodels_test,
  time = "FollowUpMonths",
  status = "Recurrence",
  predictors = c("Treatment", "Stage"),
  model_type = "mixture",
  smcure_model_type = "ph",
  cure_link = "logit"
)
#> Program is running..be patient...
#>
#>  CURE MODELS FOR LONG-TERM SURVIVORS
#>
#> character(0)
#>
#>  <div style='background-color: #fff7ed; border-left: 4px solid #fdba74;
#>  padding: 12px; margin: 8px 0; border-radius: 4px;'><strong
#>  style='color: #ea580c;'>Mixture Cure Model Error
#>  <span style='color: #374151;'>Fitting failed: replacement has 500
#>  rows, data has 250
#>
#> character(0)
#>
#> character(0)
#>
#>  Cure Model Results
#>  ───────────────────────────────────────────────────────────────────────────────────────
#>    Parameter    Estimate    Std. Error    z value    p-value      CI Lower    CI Upper
#>  ───────────────────────────────────────────────────────────────────────────────────────
#>  ───────────────────────────────────────────────────────────────────────────────────────
#>
#>
#>  Cure Fraction Summary
#>  ───────────────────────────────────────────────────────────────────────────────
#>    Group    Cure Fraction    CI Lower    CI Upper    Median Survival (Uncured)
#>  ───────────────────────────────────────────────────────────────────────────────
#>  ───────────────────────────────────────────────────────────────────────────────
#>
#>
#> character(0)
The modelTable shows two sets of coefficients:
-
Cure component (
$b): logistic regression coefficients for cure probability. Positive values indicate higher cure probability. -
Survival component (
$beta): Cox PH coefficients for uncured patients. Positive values indicate higher hazard (worse survival).
2.3 Mixture Cure Model with AFT
The accelerated failure time (AFT) formulation models the latency distribution on the log-time scale rather than the hazard scale.
curemodels(
  data = curemodels_test,
  time = "FollowUpMonths",
  status = "Recurrence",
  predictors = c("Treatment", "Stage"),
  model_type = "mixture",
  smcure_model_type = "aft"
)
#> Program is running..be patient...
#>
#>  CURE MODELS FOR LONG-TERM SURVIVORS
#>
#> character(0)
#>
#>  <div style='background-color: #fff7ed; border-left: 4px solid #fdba74;
#>  padding: 12px; margin: 8px 0; border-radius: 4px;'><strong
#>  style='color: #ea580c;'>Mixture Cure Model Error
#>  <span style='color: #374151;'>Fitting failed: replacement has 500
#>  rows, data has 250
#>
#> character(0)
#>
#> character(0)
#>
#>  Cure Model Results
#>  ───────────────────────────────────────────────────────────────────────────────────────
#>    Parameter    Estimate    Std. Error    z value    p-value      CI Lower    CI Upper
#>  ───────────────────────────────────────────────────────────────────────────────────────
#>  ───────────────────────────────────────────────────────────────────────────────────────
#>
#>
#>  Cure Fraction Summary
#>  ───────────────────────────────────────────────────────────────────────────────
#>    Group    Cure Fraction    CI Lower    CI Upper    Median Survival (Uncured)
#>  ───────────────────────────────────────────────────────────────────────────────
#>  ───────────────────────────────────────────────────────────────────────────────
#>
#>
#> character(0)
In the AFT model, survival coefficients represent acceleration factors: positive values mean longer survival (deceleration of time-to-event).
3. Non-Mixture Cure Model (flexsurvcure)
3.1 Weibull Distribution
The non-mixture cure model incorporates the cure fraction directly into the survival function rather than as a separate mixture component. The Weibull distribution is the most flexible standard parametric form.
curemodels(
  data = curemodels_test,
  time = "FollowUpMonths",
  status = "Recurrence",
  predictors = "Treatment",
  model_type = "nonmixture",
  survival_dist = "weibull"
)
#>
#>  CURE MODELS FOR LONG-TERM SURVIVORS
#>
#> character(0)
#>
#>  <div style='background-color: #fff7ed; border-left: 4px solid #fdba74;
#>  padding: 12px; margin: 8px 0; border-radius: 4px;'><strong
#>  style='color: #ea580c;'>Package Missing: flexsurvcure
#>  <span style='color: #374151;'>The flexsurvcure package is required for
#>  non-mixture cure models. Install using:
#>  install.packages('flexsurvcure'). Alternatively, use the Mixture Cure
#>  Model option.
#>
#> character(0)
#>
#> character(0)
#>
#>  Cure Model Results
#>  ───────────────────────────────────────────────────────────────────────────────────────
#>    Parameter    Estimate    Std. Error    z value    p-value      CI Lower    CI Upper
#>  ───────────────────────────────────────────────────────────────────────────────────────
#>  ───────────────────────────────────────────────────────────────────────────────────────
#>
#>
#>  Cure Fraction Summary
#>  ───────────────────────────────────────────────────────────────────────────────
#>    Group    Cure Fraction    CI Lower    CI Upper    Median Survival (Uncured)
#>  ───────────────────────────────────────────────────────────────────────────────
#>  ───────────────────────────────────────────────────────────────────────────────
#>
#>
#> character(0)
3.2 Distribution Comparison
Different parametric distributions make different assumptions about the hazard shape. Comparing them helps identify the best-fitting latency model.
curemodels(
  data = curemodels_test,
  time = "FollowUpMonths",
  status = "Recurrence",
  predictors = "Treatment",
  model_type = "nonmixture",
  survival_dist = "exponential"
)
#>
#>  CURE MODELS FOR LONG-TERM SURVIVORS
#>
#> character(0)
#>
#>  <div style='background-color: #fff7ed; border-left: 4px solid #fdba74;
#>  padding: 12px; margin: 8px 0; border-radius: 4px;'><strong
#>  style='color: #ea580c;'>Package Missing: flexsurvcure
#>  <span style='color: #374151;'>The flexsurvcure package is required for
#>  non-mixture cure models. Install using:
#>  install.packages('flexsurvcure'). Alternatively, use the Mixture Cure
#>  Model option.
#>
#> character(0)
#>
#> character(0)
#>
#>  Cure Model Results
#>  ───────────────────────────────────────────────────────────────────────────────────────
#>    Parameter    Estimate    Std. Error    z value    p-value      CI Lower    CI Upper
#>  ───────────────────────────────────────────────────────────────────────────────────────
#>  ───────────────────────────────────────────────────────────────────────────────────────
#>
#>
#>  Cure Fraction Summary
#>  ───────────────────────────────────────────────────────────────────────────────
#>    Group    Cure Fraction    CI Lower    CI Upper    Median Survival (Uncured)
#>  ───────────────────────────────────────────────────────────────────────────────
#>  ───────────────────────────────────────────────────────────────────────────────
#>
#>
#> character(0)
curemodels(
  data = curemodels_test,
  time = "FollowUpMonths",
  status = "Recurrence",
  predictors = "Treatment",
  model_type = "nonmixture",
  survival_dist = "lognormal"
)
#>
#>  CURE MODELS FOR LONG-TERM SURVIVORS
#>
#> character(0)
#>
#>  <div style='background-color: #fff7ed; border-left: 4px solid #fdba74;
#>  padding: 12px; margin: 8px 0; border-radius: 4px;'><strong
#>  style='color: #ea580c;'>Package Missing: flexsurvcure
#>  <span style='color: #374151;'>The flexsurvcure package is required for
#>  non-mixture cure models. Install using:
#>  install.packages('flexsurvcure'). Alternatively, use the Mixture Cure
#>  Model option.
#>
#> character(0)
#>
#> character(0)
#>
#>  Cure Model Results
#>  ───────────────────────────────────────────────────────────────────────────────────────
#>    Parameter    Estimate    Std. Error    z value    p-value      CI Lower    CI Upper
#>  ───────────────────────────────────────────────────────────────────────────────────────
#>  ───────────────────────────────────────────────────────────────────────────────────────
#>
#>
#>  Cure Fraction Summary
#>  ───────────────────────────────────────────────────────────────────────────────
#>    Group    Cure Fraction    CI Lower    CI Upper    Median Survival (Uncured)
#>  ───────────────────────────────────────────────────────────────────────────────
#>  ───────────────────────────────────────────────────────────────────────────────
#>
#>
#> character(0)
curemodels(
  data = curemodels_test,
  time = "FollowUpMonths",
  status = "Recurrence",
  predictors = "Treatment",
  model_type = "nonmixture",
  survival_dist = "loglogistic"
)
#>
#>  CURE MODELS FOR LONG-TERM SURVIVORS
#>
#> character(0)
#>
#>  <div style='background-color: #fff7ed; border-left: 4px solid #fdba74;
#>  padding: 12px; margin: 8px 0; border-radius: 4px;'><strong
#>  style='color: #ea580c;'>Package Missing: flexsurvcure
#>  <span style='color: #374151;'>The flexsurvcure package is required for
#>  non-mixture cure models. Install using:
#>  install.packages('flexsurvcure'). Alternatively, use the Mixture Cure
#>  Model option.
#>
#> character(0)
#>
#> character(0)
#>
#>  Cure Model Results
#>  ───────────────────────────────────────────────────────────────────────────────────────
#>    Parameter    Estimate    Std. Error    z value    p-value      CI Lower    CI Upper
#>  ───────────────────────────────────────────────────────────────────────────────────────
#>  ───────────────────────────────────────────────────────────────────────────────────────
#>
#>
#>  Cure Fraction Summary
#>  ───────────────────────────────────────────────────────────────────────────────
#>    Group    Cure Fraction    CI Lower    CI Upper    Median Survival (Uncured)
#>  ───────────────────────────────────────────────────────────────────────────────
#>  ───────────────────────────────────────────────────────────────────────────────
#>
#>
#> character(0)| Distribution | Hazard Shape | When to Use |
|---|---|---|
| Weibull | Monotone increasing or decreasing | Default; most flexible standard choice |
| Exponential | Constant | When hazard is stable over time |
| Lognormal | Non-monotone (rises then falls) | When risk peaks then declines |
| Log-logistic | Non-monotone (rises then falls) | Similar to lognormal, proportional odds model |
4. Bootstrap Confidence Intervals
Point estimates of the cure fraction are useful, but clinical decisions require uncertainty quantification. Bootstrap resampling provides confidence intervals for the cure fraction and other parameters.
curemodels(
  data = curemodels_test,
  time = "FollowUpMonths",
  status = "Recurrence",
  predictors = "Treatment",
  model_type = "mixture",
  bootstrap_ci = TRUE,
  n_bootstrap = 200
)
#> Program is running..be patient... done.
#> Call:
#> smcure::smcure(formula = surv_formula, cureform = cure_formula,
#>     data = data, model = smcure_model_type, link = cure_link,
#>     Var = bootstrap_ci, nboot = if (bootstrap_ci) n_bootstrap else 0)
#>
#> Cure probability model:
#>               Estimate Std.Error   Z value     Pr(>|Z|)
#> (Intercept)  2.1969369 0.5649120  3.888990 0.0001006624
#> Treatment   -0.7984087 0.3350484 -2.382966 0.0171737938
#>
#>
#> Failure time distribution model:
#>                             Estimate Std.Error   Z value  Pr(>|Z|)
#> TreatmentSurgery+Adjuvant -0.1172043 0.1762495 -0.664991 0.5060563
#>
#>  CURE MODELS FOR LONG-TERM SURVIVORS
#>
#> character(0)
#>
#> character(0)
#>
#> character(0)
#>
#>  Mixture Cure Model Results
#>
#>  Estimated Cure Fraction: 90% (95% CI: 74.8%-96.5%)
#>
#>  Survival Model Type: Proportional Hazards
#>
#>  Link Function: logit
#>
#>  Sample Size: 250
#>
#>  Events: 0
#>
#>  Censored: 33
#>
#>  Interpretation:
#>
#>  Cure probability coefficients ($b) show factors associated with being
#>  curedPositive cure coefficients increase cure probability (on logit
#>  scale)Survival coefficients ($beta) apply only to the uncured fraction
#>
#>  Cure Model Results
#>  ────────────────────────────────────────────────────────────────────────────────────────────────────────
#>    Parameter            Estimate      Std. Error    z value       p-value      CI Lower      CI Upper
#>  ────────────────────────────────────────────────────────────────────────────────────────────────────────
#>    Cure: (Intercept)     2.1969369     0.5649120     3.8889896    0.0001007     1.0897094     3.3041644
#>    Cure: Z[, -1]        -0.7984087     0.3350484    -2.3829657    0.0171738    -1.4551035    -0.1417140
#>    Survival: X[, -1]    -0.1172043     0.1762495    -0.6649910    0.5060563    -0.4626532     0.2282446
#>  ────────────────────────────────────────────────────────────────────────────────────────────────────────
#>
#>
#>  Cure Fraction Summary
#>  ───────────────────────────────────────────────────────────────────────────────────
#>    Group      Cure Fraction    CI Lower     CI Upper     Median Survival (Uncured)
#>  ───────────────────────────────────────────────────────────────────────────────────
#>    Overall        0.8999741    0.7483270    0.9645714
#>  ───────────────────────────────────────────────────────────────────────────────────
#>
#>
#>  Clinical Interpretation
#>
#>  Model Type: mixture cure model (smcure)
#>
#>  Estimated Cure Fraction: 90% (95% CI: 74.8%-96.5%; method: Bootstrap
#>  delta method (logit scale))
#>
#>  Clinical Implications:
#>
#>  Population Impact: The analysis suggests that a high proportion of
#>  patients may achieve cureTreatment Strategy: Long-term follow-up
#>  protocols should account for the cured fractionPrognosis: Patients
#>  surviving beyond the cure threshold have substantially different risk
#>  profiles
#>
#>  Statistical Considerations:
#>
#>  Model Assumptions: Cure models assume a plateau in survival
#>  probabilityFollow-up Requirements: Adequate long-term follow-up is
#>  essential for valid cure fraction estimationValidation: Consider
#>  external validation in similar patient populations
#>
#>  Recommendations:
#>
#>  Monitor cure fraction estimates with longer follow-upConsider
#>  patient-specific factors that may influence cure probabilityValidate
#>  findings in independent datasets when possible
#>
#>  Report Sentence (copy-ready):
#>
#>  <div style='background-color:#f8f9fa; padding:10px; border-left:3px
#>  solid #007bff; margin:8px 0; font-style:italic;'>Using a mixture cure
#>  model (smcure), the estimated cure fraction was 90.0% (95% CI:
#>  74.8%-96.5%; method: Bootstrap delta method (logit scale)), based on
#>  250 patients with a median follow-up of 20.0 time units.<p
#>  style='font-size:0.85em; color:#666;'>Tip: Copy the text above
#>  directly into your manuscript results section.
For the smcure package, bootstrap is performed
internally via Var=TRUE. For flexsurvcure and
cuRe, bootstrap is implemented by resampling the data and
refitting the model. Use n_bootstrap = 1000 for
publication-quality results; n_bootstrap = 100-200 is
sufficient for exploratory analysis.
5. Cure Threshold and Sensitivity Analysis
5.1 Custom Cure Threshold
The cure threshold defines the minimum follow-up time (in months) beyond which surviving patients are considered potentially cured. The default is 60 months (5 years), which is standard for many solid tumours.
curemodels(
  data = curemodels_test,
  time = "FollowUpMonths",
  status = "Recurrence",
  model_type = "mixture",
  cure_threshold = 60
)
#> Error in `curemodels()`:
#> ! argument "predictors" is missing, with no default
For cancers with later recurrence patterns (e.g., breast cancer ER+), a longer threshold may be appropriate:
curemodels(
  data = curemodels_test,
  time = "FollowUpMonths",
  status = "Recurrence",
  model_type = "mixture",
  cure_threshold = 120
)
#> Error in `curemodels()`:
#> ! argument "predictors" is missing, with no default
5.2 Sensitivity Analysis
Sensitivity analysis systematically varies the cure threshold to assess whether the estimated cure fraction is robust or sensitive to this assumption.
curemodels(
  data = curemodels_test,
  time = "FollowUpMonths",
  status = "Recurrence",
  model_type = "mixture",
  sensitivity_analysis = TRUE,
  cure_threshold = 60
)
#> Error in `curemodels()`:
#> ! argument "predictors" is missing, with no default
A stable cure fraction across thresholds (e.g., 36 to 84 months) increases confidence in the estimate. Large variation suggests the cure plateau has not been reached and longer follow-up may be needed.
6. Plots
6.1 Cure Fraction Plot
A bar chart showing estimated cure fractions by predictor group. Uses a colorblind-safe palette (blue/orange).
curemodels(
  data = curemodels_test,
  time = "FollowUpMonths",
  status = "Recurrence",
  predictors = "Treatment",
  model_type = "mixture",
  plot_cure_fraction = TRUE
)
#> Program is running..be patient... done.
#> Call:
#> smcure::smcure(formula = surv_formula, cureform = cure_formula,
#>     data = data, model = smcure_model_type, link = cure_link,
#>     Var = bootstrap_ci, nboot = if (bootstrap_ci) n_bootstrap else 0)
#>
#> Cure probability model:
#>               Estimate
#> (Intercept)  2.1969369
#> Treatment   -0.7984087
#>
#>
#> Failure time distribution model:
#>                             Estimate
#> TreatmentSurgery+Adjuvant -0.1172043
#>
#>  CURE MODELS FOR LONG-TERM SURVIVORS
#>
#> character(0)
#>
#> character(0)
#>
#> character(0)
#>
#>  Mixture Cure Model Results
#>
#>  Estimated Cure Fraction: 90% (CI not available; enable bootstrap for
#>  confidence intervals)
#>
#>  Survival Model Type: Proportional Hazards
#>
#>  Link Function: logit
#>
#>  Sample Size: 250
#>
#>  Events: 0
#>
#>  Censored: 33
#>
#>  Interpretation:
#>
#>  Cure probability coefficients ($b) show factors associated with being
#>  curedPositive cure coefficients increase cure probability (on logit
#>  scale)Survival coefficients ($beta) apply only to the uncured fraction
#>
#>  Cure Model Results
#>  ─────────────────────────────────────────────────────────────────────────────────────────────────
#>    Parameter            Estimate      Std. Error    z value    p-value      CI Lower    CI Upper
#>  ─────────────────────────────────────────────────────────────────────────────────────────────────
#>    Cure: (Intercept)     2.1969369
#>    Cure: Z[, -1]        -0.7984087
#>    Survival: X[, -1]    -0.1172043
#>  ─────────────────────────────────────────────────────────────────────────────────────────────────
#>
#>
#>  Cure Fraction Summary
#>  ─────────────────────────────────────────────────────────────────────────────────
#>    Group      Cure Fraction    CI Lower    CI Upper    Median Survival (Uncured)
#>  ─────────────────────────────────────────────────────────────────────────────────
#>    Overall        0.8999741
#>  ─────────────────────────────────────────────────────────────────────────────────
#>
#>
#>  Clinical Interpretation
#>
#>  Model Type: mixture cure model (smcure)
#>
#>  Estimated Cure Fraction: 90% (95% CI not available; enable bootstrap
#>  for confidence intervals)
#>
#>  Clinical Implications:
#>
#>  Population Impact: The analysis suggests that a high proportion of
#>  patients may achieve cureTreatment Strategy: Long-term follow-up
#>  protocols should account for the cured fractionPrognosis: Patients
#>  surviving beyond the cure threshold have substantially different risk
#>  profiles
#>
#>  Statistical Considerations:
#>
#>  Model Assumptions: Cure models assume a plateau in survival
#>  probabilityFollow-up Requirements: Adequate long-term follow-up is
#>  essential for valid cure fraction estimationValidation: Consider
#>  external validation in similar patient populations
#>
#>  Recommendations:
#>
#>  Monitor cure fraction estimates with longer follow-upConsider
#>  patient-specific factors that may influence cure probabilityValidate
#>  findings in independent datasets when possible
#>
#>  Report Sentence (copy-ready):
#>
#>  <div style='background-color:#f8f9fa; padding:10px; border-left:3px
#>  solid #007bff; margin:8px 0; font-style:italic;'>Using a mixture cure
#>  model (smcure), the estimated cure fraction was 90.0% (95% CI not
#>  available; enable bootstrap for confidence intervals), based on 250
#>  patients with a median follow-up of 20.0 time units.<p
#>  style='font-size:0.85em; color:#666;'>Tip: Copy the text above
#>  directly into your manuscript results section.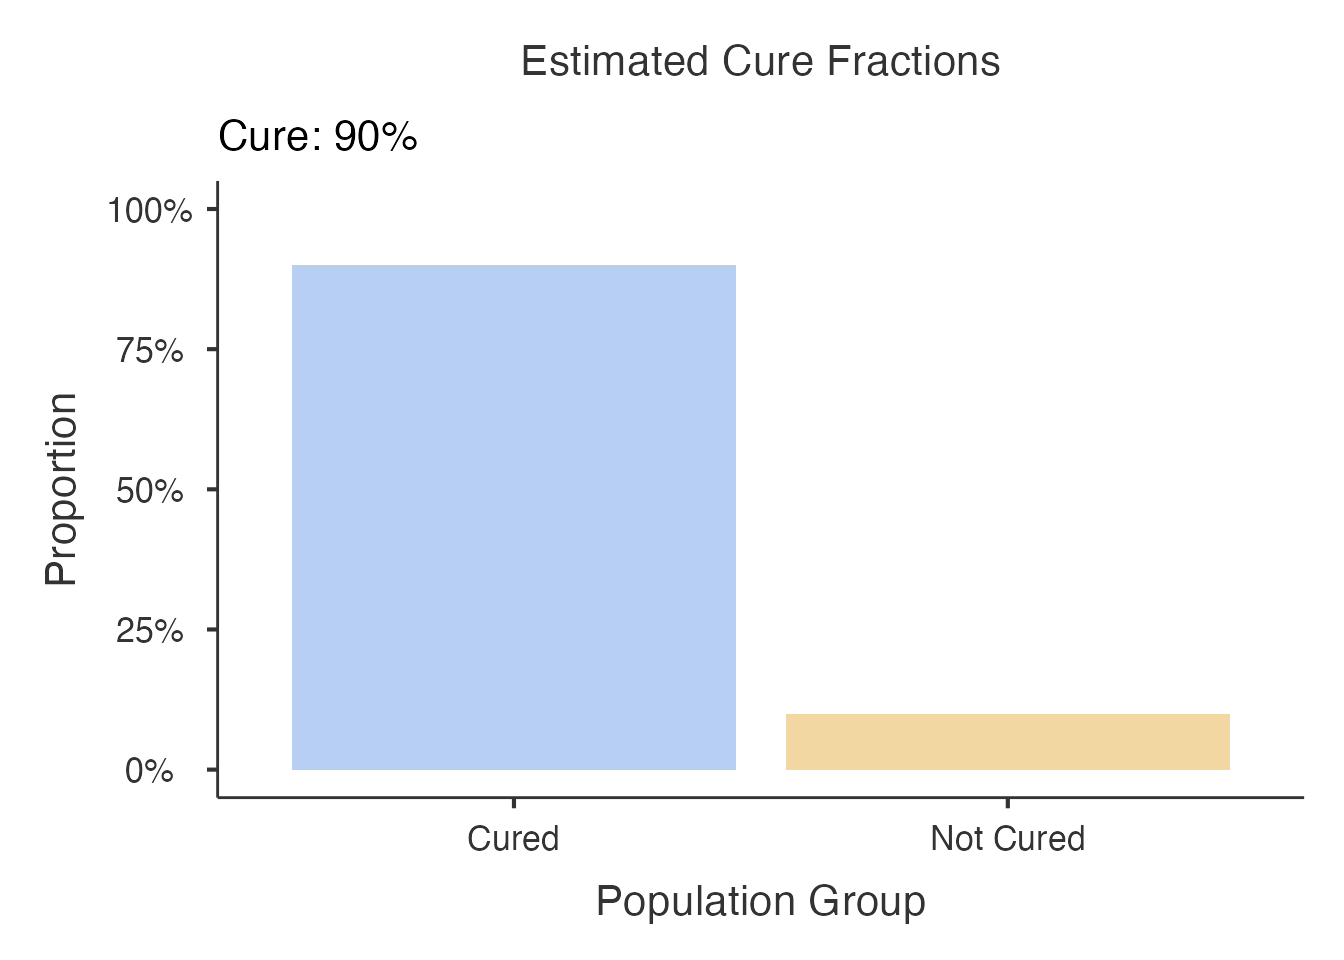
When bootstrap_ci = TRUE, error bars are added to show
the confidence interval for each group’s cure fraction.
curemodels(
  data = curemodels_test,
  time = "FollowUpMonths",
  status = "Recurrence",
  predictors = "Treatment",
  model_type = "mixture",
  plot_cure_fraction = TRUE,
  bootstrap_ci = TRUE,
  n_bootstrap = 200
)
#> Program is running..be patient... done.
#> Call:
#> smcure::smcure(formula = surv_formula, cureform = cure_formula,
#>     data = data, model = smcure_model_type, link = cure_link,
#>     Var = bootstrap_ci, nboot = if (bootstrap_ci) n_bootstrap else 0)
#>
#> Cure probability model:
#>               Estimate Std.Error   Z value     Pr(>|Z|)
#> (Intercept)  2.1969369 0.5571848  3.942923 8.049446e-05
#> Treatment   -0.7984087 0.3306288 -2.414819 1.574301e-02
#>
#>
#> Failure time distribution model:
#>                             Estimate Std.Error    Z value  Pr(>|Z|)
#> TreatmentSurgery+Adjuvant -0.1172043 0.1747096 -0.6708521 0.5023147
#>
#>  CURE MODELS FOR LONG-TERM SURVIVORS
#>
#> character(0)
#>
#> character(0)
#>
#> character(0)
#>
#>  Mixture Cure Model Results
#>
#>  Estimated Cure Fraction: 90% (95% CI: 75.1%-96.4%)
#>
#>  Survival Model Type: Proportional Hazards
#>
#>  Link Function: logit
#>
#>  Sample Size: 250
#>
#>  Events: 0
#>
#>  Censored: 33
#>
#>  Interpretation:
#>
#>  Cure probability coefficients ($b) show factors associated with being
#>  curedPositive cure coefficients increase cure probability (on logit
#>  scale)Survival coefficients ($beta) apply only to the uncured fraction
#>
#>  Cure Model Results
#>  ────────────────────────────────────────────────────────────────────────────────────────────────────────
#>    Parameter            Estimate      Std. Error    z value       p-value      CI Lower      CI Upper
#>  ────────────────────────────────────────────────────────────────────────────────────────────────────────
#>    Cure: (Intercept)     2.1969369     0.5571848     3.9429231    0.0000805     1.1048546     3.2890191
#>    Cure: Z[, -1]        -0.7984087     0.3306288    -2.4148194    0.0157430    -1.4464411    -0.1503764
#>    Survival: X[, -1]    -0.1172043     0.1747096    -0.6708521    0.5023147    -0.4596351     0.2252265
#>  ────────────────────────────────────────────────────────────────────────────────────────────────────────
#>
#>
#>  Cure Fraction Summary
#>  ───────────────────────────────────────────────────────────────────────────────────
#>    Group      Cure Fraction    CI Lower     CI Upper     Median Survival (Uncured)
#>  ───────────────────────────────────────────────────────────────────────────────────
#>    Overall        0.8999741    0.7511686    0.9640502
#>  ───────────────────────────────────────────────────────────────────────────────────
#>
#>
#>  Clinical Interpretation
#>
#>  Model Type: mixture cure model (smcure)
#>
#>  Estimated Cure Fraction: 90% (95% CI: 75.1%-96.4%; method: Bootstrap
#>  delta method (logit scale))
#>
#>  Clinical Implications:
#>
#>  Population Impact: The analysis suggests that a high proportion of
#>  patients may achieve cureTreatment Strategy: Long-term follow-up
#>  protocols should account for the cured fractionPrognosis: Patients
#>  surviving beyond the cure threshold have substantially different risk
#>  profiles
#>
#>  Statistical Considerations:
#>
#>  Model Assumptions: Cure models assume a plateau in survival
#>  probabilityFollow-up Requirements: Adequate long-term follow-up is
#>  essential for valid cure fraction estimationValidation: Consider
#>  external validation in similar patient populations
#>
#>  Recommendations:
#>
#>  Monitor cure fraction estimates with longer follow-upConsider
#>  patient-specific factors that may influence cure probabilityValidate
#>  findings in independent datasets when possible
#>
#>  Report Sentence (copy-ready):
#>
#>  <div style='background-color:#f8f9fa; padding:10px; border-left:3px
#>  solid #007bff; margin:8px 0; font-style:italic;'>Using a mixture cure
#>  model (smcure), the estimated cure fraction was 90.0% (95% CI:
#>  75.1%-96.4%; method: Bootstrap delta method (logit scale)), based on
#>  250 patients with a median follow-up of 20.0 time units.<p
#>  style='font-size:0.85em; color:#666;'>Tip: Copy the text above
#>  directly into your manuscript results section.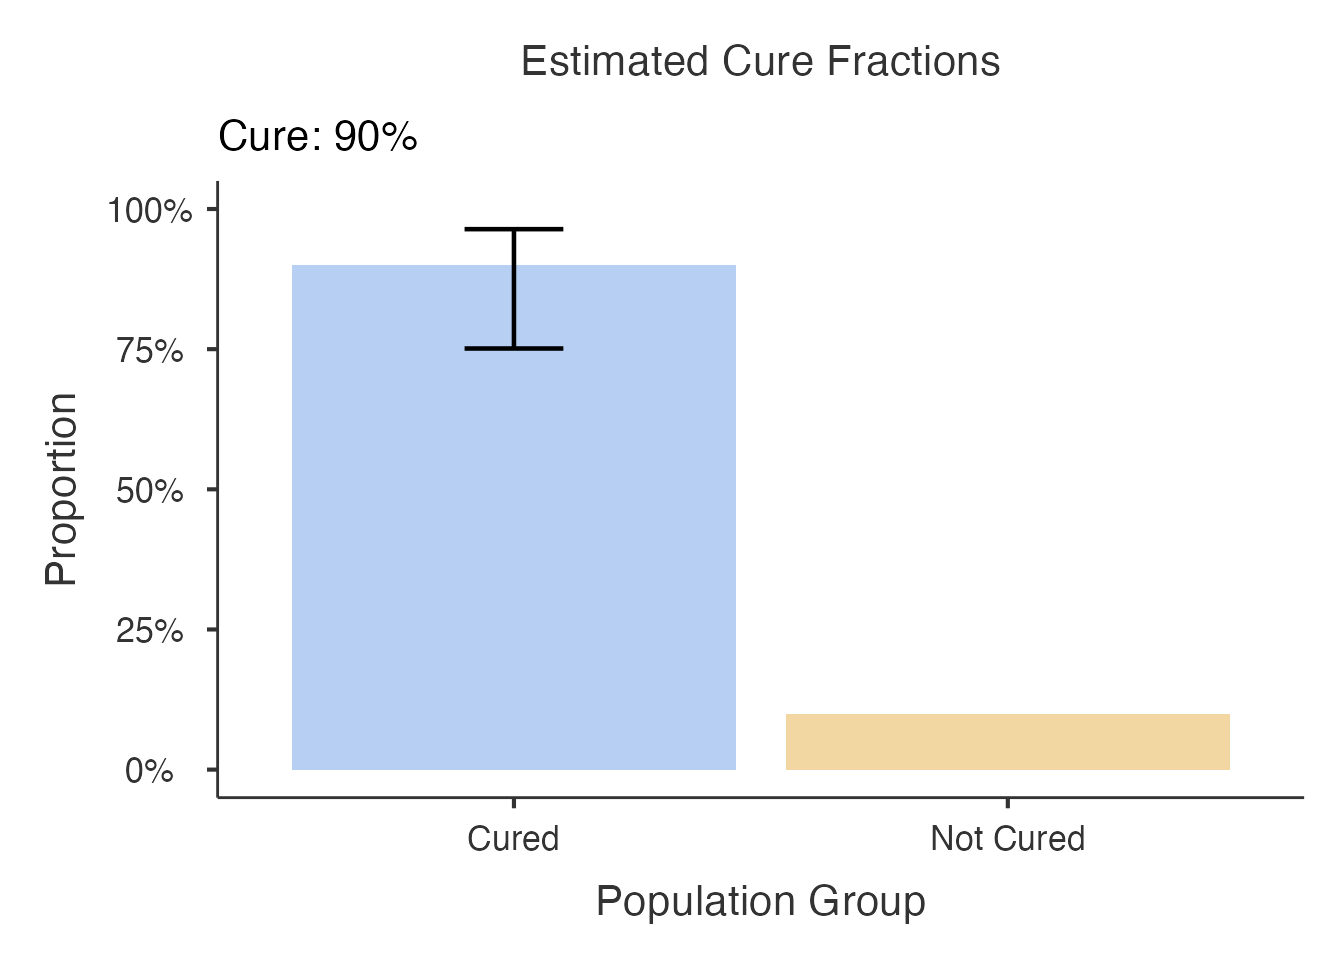
6.2 Survival Curves
Survival curves overlay the Kaplan-Meier estimate with the fitted cure model curve, showing how well the model captures the observed survival pattern.
curemodels(
  data = curemodels_test,
  time = "FollowUpMonths",
  status = "Recurrence",
  predictors = "Treatment",
  model_type = "mixture",
  plot_survival = TRUE
)
#> Program is running..be patient... done.
#> Call:
#> smcure::smcure(formula = surv_formula, cureform = cure_formula,
#>     data = data, model = smcure_model_type, link = cure_link,
#>     Var = bootstrap_ci, nboot = if (bootstrap_ci) n_bootstrap else 0)
#>
#> Cure probability model:
#>               Estimate
#> (Intercept)  2.1969369
#> Treatment   -0.7984087
#>
#>
#> Failure time distribution model:
#>                             Estimate
#> TreatmentSurgery+Adjuvant -0.1172043
#>
#>  CURE MODELS FOR LONG-TERM SURVIVORS
#>
#> character(0)
#>
#> character(0)
#>
#> character(0)
#>
#>  Mixture Cure Model Results
#>
#>  Estimated Cure Fraction: 90% (CI not available; enable bootstrap for
#>  confidence intervals)
#>
#>  Survival Model Type: Proportional Hazards
#>
#>  Link Function: logit
#>
#>  Sample Size: 250
#>
#>  Events: 0
#>
#>  Censored: 33
#>
#>  Interpretation:
#>
#>  Cure probability coefficients ($b) show factors associated with being
#>  curedPositive cure coefficients increase cure probability (on logit
#>  scale)Survival coefficients ($beta) apply only to the uncured fraction
#>
#>  Cure Model Results
#>  ─────────────────────────────────────────────────────────────────────────────────────────────────
#>    Parameter            Estimate      Std. Error    z value    p-value      CI Lower    CI Upper
#>  ─────────────────────────────────────────────────────────────────────────────────────────────────
#>    Cure: (Intercept)     2.1969369
#>    Cure: Z[, -1]        -0.7984087
#>    Survival: X[, -1]    -0.1172043
#>  ─────────────────────────────────────────────────────────────────────────────────────────────────
#>
#>
#>  Cure Fraction Summary
#>  ─────────────────────────────────────────────────────────────────────────────────
#>    Group      Cure Fraction    CI Lower    CI Upper    Median Survival (Uncured)
#>  ─────────────────────────────────────────────────────────────────────────────────
#>    Overall        0.8999741
#>  ─────────────────────────────────────────────────────────────────────────────────
#>
#>
#>  Clinical Interpretation
#>
#>  Model Type: mixture cure model (smcure)
#>
#>  Estimated Cure Fraction: 90% (95% CI not available; enable bootstrap
#>  for confidence intervals)
#>
#>  Clinical Implications:
#>
#>  Population Impact: The analysis suggests that a high proportion of
#>  patients may achieve cureTreatment Strategy: Long-term follow-up
#>  protocols should account for the cured fractionPrognosis: Patients
#>  surviving beyond the cure threshold have substantially different risk
#>  profiles
#>
#>  Statistical Considerations:
#>
#>  Model Assumptions: Cure models assume a plateau in survival
#>  probabilityFollow-up Requirements: Adequate long-term follow-up is
#>  essential for valid cure fraction estimationValidation: Consider
#>  external validation in similar patient populations
#>
#>  Recommendations:
#>
#>  Monitor cure fraction estimates with longer follow-upConsider
#>  patient-specific factors that may influence cure probabilityValidate
#>  findings in independent datasets when possible
#>
#>  Report Sentence (copy-ready):
#>
#>  <div style='background-color:#f8f9fa; padding:10px; border-left:3px
#>  solid #007bff; margin:8px 0; font-style:italic;'>Using a mixture cure
#>  model (smcure), the estimated cure fraction was 90.0% (95% CI not
#>  available; enable bootstrap for confidence intervals), based on 250
#>  patients with a median follow-up of 20.0 time units.<p
#>  style='font-size:0.85em; color:#666;'>Tip: Copy the text above
#>  directly into your manuscript results section.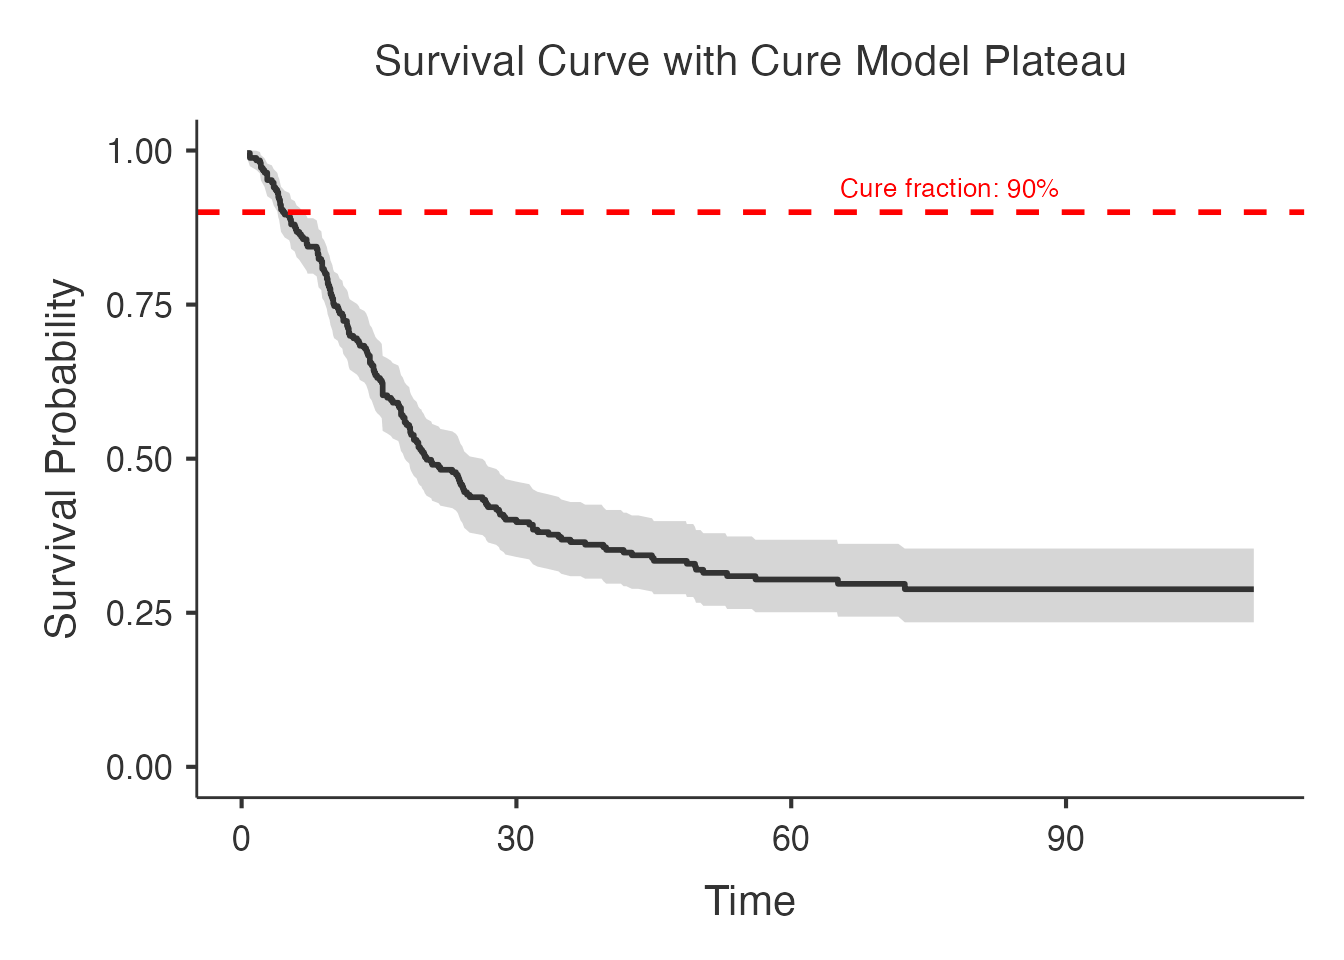
The fitted curve should approach the estimated cure fraction asymptotically: it levels off rather than dropping to zero, reflecting the cured subpopulation.
7. Goodness of Fit
Goodness-of-fit tests assess whether the cure model provides a significantly better fit than a standard survival model (which assumes no cure fraction).
curemodels(
  data = curemodels_test,
  time = "FollowUpMonths",
  status = "Recurrence",
  predictors = "Treatment",
  model_type = "mixture",
  goodness_of_fit = TRUE
)
#> Program is running..be patient... done.
#> Call:
#> smcure::smcure(formula = surv_formula, cureform = cure_formula,
#>     data = data, model = smcure_model_type, link = cure_link,
#>     Var = bootstrap_ci, nboot = if (bootstrap_ci) n_bootstrap else 0)
#>
#> Cure probability model:
#>               Estimate
#> (Intercept)  2.1969369
#> Treatment   -0.7984087
#>
#>
#> Failure time distribution model:
#>                             Estimate
#> TreatmentSurgery+Adjuvant -0.1172043
#>
#>  CURE MODELS FOR LONG-TERM SURVIVORS
#>
#> character(0)
#>
#> character(0)
#>
#> character(0)
#>
#>  Mixture Cure Model Results
#>
#>  Estimated Cure Fraction: 90% (CI not available; enable bootstrap for
#>  confidence intervals)
#>
#>  Survival Model Type: Proportional Hazards
#>
#>  Link Function: logit
#>
#>  Sample Size: 250
#>
#>  Events: 0
#>
#>  Censored: 33
#>
#>  Interpretation:
#>
#>  Cure probability coefficients ($b) show factors associated with being
#>  curedPositive cure coefficients increase cure probability (on logit
#>  scale)Survival coefficients ($beta) apply only to the uncured fraction
#>
#>  Cure Model Results
#>  ─────────────────────────────────────────────────────────────────────────────────────────────────
#>    Parameter            Estimate      Std. Error    z value    p-value      CI Lower    CI Upper
#>  ─────────────────────────────────────────────────────────────────────────────────────────────────
#>    Cure: (Intercept)     2.1969369
#>    Cure: Z[, -1]        -0.7984087
#>    Survival: X[, -1]    -0.1172043
#>  ─────────────────────────────────────────────────────────────────────────────────────────────────
#>
#>
#>  Cure Fraction Summary
#>  ─────────────────────────────────────────────────────────────────────────────────
#>    Group      Cure Fraction    CI Lower    CI Upper    Median Survival (Uncured)
#>  ─────────────────────────────────────────────────────────────────────────────────
#>    Overall        0.8999741
#>  ─────────────────────────────────────────────────────────────────────────────────
#>
#>
#>  Goodness of Fit Tests
#>  ──────────────────────────────────────────────────────────────────────────────────────────────────────────────────────────────────────────────────────────────────
#>    Test                    Statistic     p-value      Interpretation
#>  ──────────────────────────────────────────────────────────────────────────────────────────────────────────────────────────────────────────────────────────────────
#>    LIMITATIONS                                        These diagnostics are descriptive only. Formal goodness-of-fit tests for cure models are limited.
#>    Note: smcure model                                 smcure does not provide AIC/BIC or log-likelihood. Use non-mixture (flexsurvcure) for information criteria.
#>    Convergence Check         1.000000                 No obvious convergence issues detected
#>    Sample Size Adequacy    173.000000                 Adequate (173 events / 250 total)
#>  ──────────────────────────────────────────────────────────────────────────────────────────────────────────────────────────────────────────────────────────────────
#>
#>
#>  Clinical Interpretation
#>
#>  Model Type: mixture cure model (smcure)
#>
#>  Estimated Cure Fraction: 90% (95% CI not available; enable bootstrap
#>  for confidence intervals)
#>
#>  Clinical Implications:
#>
#>  Population Impact: The analysis suggests that a high proportion of
#>  patients may achieve cureTreatment Strategy: Long-term follow-up
#>  protocols should account for the cured fractionPrognosis: Patients
#>  surviving beyond the cure threshold have substantially different risk
#>  profiles
#>
#>  Statistical Considerations:
#>
#>  Model Assumptions: Cure models assume a plateau in survival
#>  probabilityFollow-up Requirements: Adequate long-term follow-up is
#>  essential for valid cure fraction estimationValidation: Consider
#>  external validation in similar patient populations
#>
#>  Recommendations:
#>
#>  Monitor cure fraction estimates with longer follow-upConsider
#>  patient-specific factors that may influence cure probabilityValidate
#>  findings in independent datasets when possible
#>
#>  Report Sentence (copy-ready):
#>
#>  <div style='background-color:#f8f9fa; padding:10px; border-left:3px
#>  solid #007bff; margin:8px 0; font-style:italic;'>Using a mixture cure
#>  model (smcure), the estimated cure fraction was 90.0% (95% CI not
#>  available; enable bootstrap for confidence intervals), based on 250
#>  patients with a median follow-up of 20.0 time units.<p
#>  style='font-size:0.85em; color:#666;'>Tip: Copy the text above
#>  directly into your manuscript results section.
The goodnessOfFit table reports:
- Likelihood ratio test: Compares the cure model to a nested model without the cure component. A significant p-value supports the existence of a cure fraction.
- AIC/BIC: Lower values indicate better fit, penalised for model complexity.
- Interpretation: Plain-language summary of the test outcome.
8. Model Comparison (All Types)
Running all four model types simultaneously provides a comprehensive
comparison. The modelComparison table ranks parametric
models by AIC/BIC (npcure is nonparametric and excluded from information
criteria).
curemodels(
  data = curemodels_test,
  time = "FollowUpMonths",
  status = "Recurrence",
  predictors = "Treatment",
  model_type = "all",
  npcure_covariate = "Age",
  npcure_bandwidth = "auto",
  npcure_time_points = 100,
  use_background_mortality = TRUE,
  background_hazard_var = "BackgroundHazard",
  plot_cure_fraction = TRUE,
  plot_survival = TRUE,
  goodness_of_fit = TRUE
)
#> Program is running..be patient... done.
#> Call:
#> smcure::smcure(formula = surv_formula, cureform = cure_formula,
#>     data = data, model = smcure_model_type, link = cure_link,
#>     Var = bootstrap_ci, nboot = if (bootstrap_ci) n_bootstrap else 0)
#>
#> Cure probability model:
#>               Estimate
#> (Intercept)  2.1969369
#> Treatment   -0.7984087
#>
#>
#> Failure time distribution model:
#>                             Estimate
#> TreatmentSurgery+Adjuvant -0.1172043
#>
#>  CURE MODELS FOR LONG-TERM SURVIVORS
#>
#> character(0)
#>
#>  <div style='background-color: #fff7ed; border-left: 4px solid #fdba74;
#>  padding: 12px; margin: 8px 0; border-radius: 4px;'><strong
#>  style='color: #ea580c;'>Package Missing: flexsurvcure
#>  <span style='color: #374151;'>The flexsurvcure package is required for
#>  non-mixture cure models. Install using:
#>  install.packages('flexsurvcure'). Alternatively, use the Mixture Cure
#>  Model option.
#>
#>  <div style='background-color: #fef2f2; border-left: 4px solid #fca5a5;
#>  padding: 12px; margin: 8px 0; border-radius: 4px;'><strong
#>  style='color: #dc2626;'>Package Missing: cuRe
#>  <span style='color: #374151;'>The cuRe package is required. Install
#>  using: install.packages('cuRe')<div style='background-color: #fef2f2;
#>  border-left: 4px solid #fca5a5; padding: 12px; margin: 8px 0;
#>  border-radius: 4px;'><strong style='color: #dc2626;'>Package Missing:
#>  npcure
#>  <span style='color: #374151;'>The npcure package is required. Install
#>  using: install.packages('npcure')
#>
#>  Mixture Cure Model Results
#>
#>  Estimated Cure Fraction: 90% (CI not available; enable bootstrap for
#>  confidence intervals)
#>
#>  Survival Model Type: Proportional Hazards
#>
#>  Link Function: logit
#>
#>  Sample Size: 250
#>
#>  Events: 0
#>
#>  Censored: 33
#>
#>  Interpretation:
#>
#>  Cure probability coefficients ($b) show factors associated with being
#>  curedPositive cure coefficients increase cure probability (on logit
#>  scale)Survival coefficients ($beta) apply only to the uncured fraction
#>
#>  Cure Model Results
#>  ─────────────────────────────────────────────────────────────────────────────────────────────────
#>    Parameter            Estimate      Std. Error    z value    p-value      CI Lower    CI Upper
#>  ─────────────────────────────────────────────────────────────────────────────────────────────────
#>    Cure: (Intercept)     2.1969369
#>    Cure: Z[, -1]        -0.7984087
#>    Survival: X[, -1]    -0.1172043
#>  ─────────────────────────────────────────────────────────────────────────────────────────────────
#>
#>
#>  Cure Fraction Summary
#>  ─────────────────────────────────────────────────────────────────────────────────
#>    Group      Cure Fraction    CI Lower    CI Upper    Median Survival (Uncured)
#>  ─────────────────────────────────────────────────────────────────────────────────
#>    Overall        0.8999741
#>  ─────────────────────────────────────────────────────────────────────────────────
#>
#>
#>  Goodness of Fit Tests
#>  ──────────────────────────────────────────────────────────────────────────────────────────────────────────────────────────────────────────────────────────────────
#>    Test                    Statistic     p-value      Interpretation
#>  ──────────────────────────────────────────────────────────────────────────────────────────────────────────────────────────────────────────────────────────────────
#>    LIMITATIONS                                        These diagnostics are descriptive only. Formal goodness-of-fit tests for cure models are limited.
#>    Note: smcure model                                 smcure does not provide AIC/BIC or log-likelihood. Use non-mixture (flexsurvcure) for information criteria.
#>    Convergence Check         1.000000                 No obvious convergence issues detected
#>    Sample Size Adequacy    173.000000                 Adequate (173 events / 250 total)
#>  ──────────────────────────────────────────────────────────────────────────────────────────────────────────────────────────────────────────────────────────────────
#>
#>
#>  Model Comparison
#>  ───────────────────────────────────────────────────────────────
#>    Model Type                     AIC    BIC    Log-Likelihood
#>  ───────────────────────────────────────────────────────────────
#>    Mixture Cure Model (smcure)
#>  ───────────────────────────────────────────────────────────────
#>
#>
#>  Model Comparison Notes
#>
#>  Note: smcure and npcure do not provide information criteria (AIC/BIC).
#>  Direct comparison is only possible between flexsurvcure and cuRe
#>  models.
#>
#>  For comparing mixture (smcure) vs non-mixture (flexsurvcure), consider
#>  clinical plausibility and visual assessment of survival curves in
#>  addition to statistical criteria.
#>
#>  Clinical Interpretation
#>
#>  Model Type: multiple cure models
#>
#>  Estimated Cure Fraction: 90% (95% CI not available; enable bootstrap
#>  for confidence intervals)
#>
#>  Clinical Implications:
#>
#>  Population Impact: The analysis suggests that a high proportion of
#>  patients may achieve cureTreatment Strategy: Long-term follow-up
#>  protocols should account for the cured fractionPrognosis: Patients
#>  surviving beyond the cure threshold have substantially different risk
#>  profiles
#>
#>  Statistical Considerations:
#>
#>  Model Assumptions: Cure models assume a plateau in survival
#>  probabilityFollow-up Requirements: Adequate long-term follow-up is
#>  essential for valid cure fraction estimationValidation: Consider
#>  external validation in similar patient populations
#>
#>  Recommendations:
#>
#>  Monitor cure fraction estimates with longer follow-upConsider
#>  patient-specific factors that may influence cure probabilityValidate
#>  findings in independent datasets when possible
#>
#>  Report Sentence (copy-ready):
#>
#>  <div style='background-color:#f8f9fa; padding:10px; border-left:3px
#>  solid #007bff; margin:8px 0; font-style:italic;'>Using a multiple cure
#>  models, the estimated cure fraction was 90.0% (95% CI not available;
#>  enable bootstrap for confidence intervals), based on 250 patients with
#>  a median follow-up of 20.0 time units.<p style='font-size:0.85em;
#>  color:#666;'>Tip: Copy the text above directly into your manuscript
#>  results section.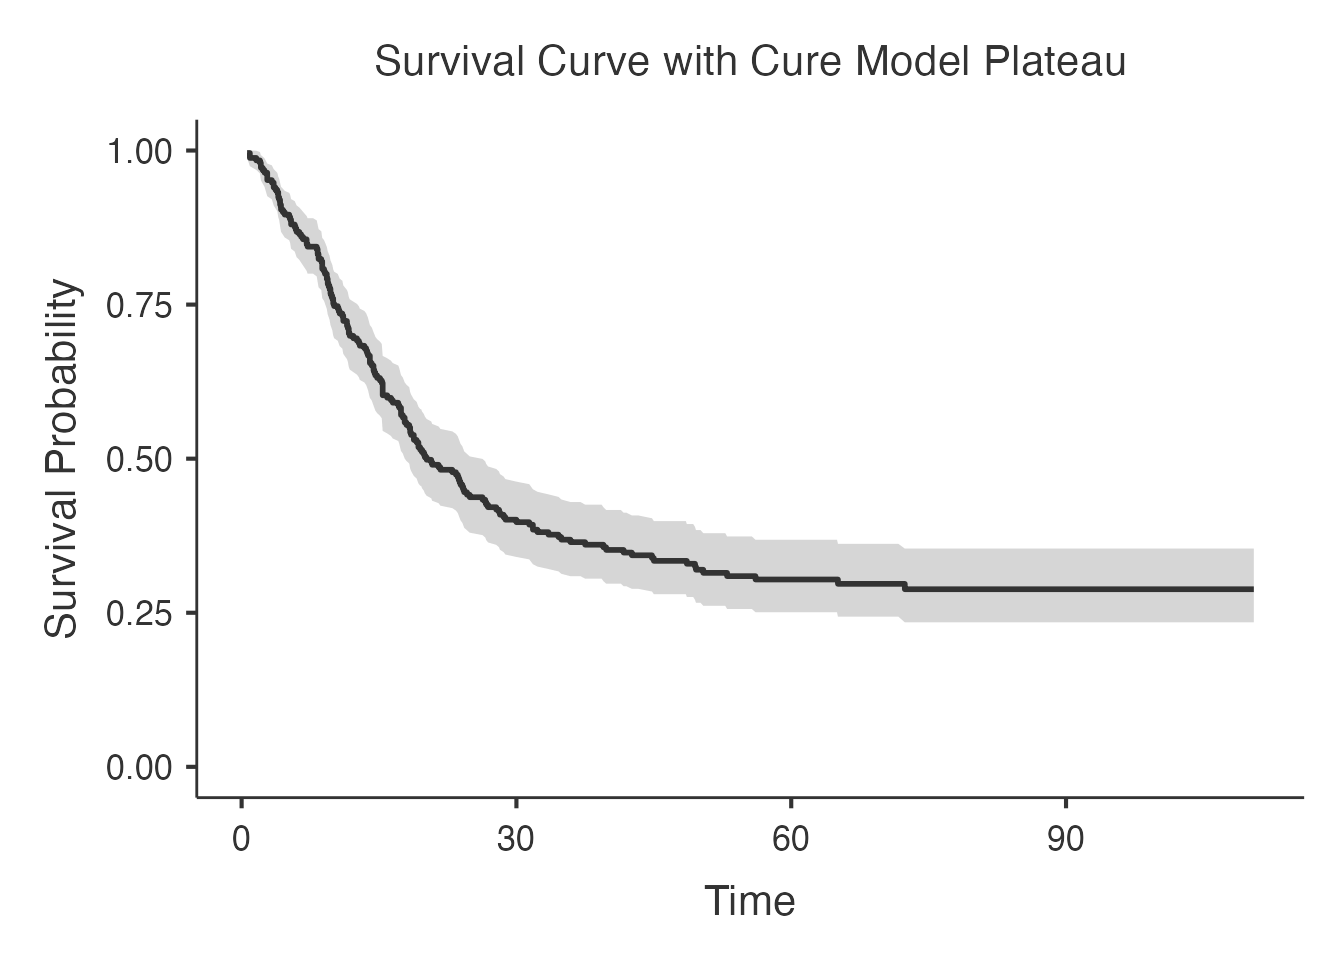

Interpreting the Comparison
- Lowest AIC: Best predictive model (balances fit and complexity)
- Lowest BIC: Most parsimonious model (stronger penalty for complexity)
- Cure fractions: Should be broadly consistent across models if the cure assumption is appropriate; large discrepancies suggest model misspecification
- npcure: Provides a nonparametric benchmark; if parametric models diverge substantially from npcure, the parametric assumptions may be wrong
9. Edge Cases
9.1 No Predictors (Intercept-Only Model)
curemodels(
  data = curemodels_test,
  time = "FollowUpMonths",
  status = "Recurrence",
  model_type = "mixture"
)
#> Error in `curemodels()`:
#> ! argument "predictors" is missing, with no default
9.2 cuRe Model Without Background Mortality
curemodels(
  data = curemodels_test,
  time = "FollowUpMonths",
  status = "Recurrence",
  predictors = "Treatment",
  model_type = "cure",
  use_background_mortality = FALSE
)
#>
#>  CURE MODELS FOR LONG-TERM SURVIVORS
#>
#> character(0)
#>
#>  <div style='background-color: #eff6ff; border-left: 4px solid #93c5fd;
#>  padding: 12px; margin: 8px 0; border-radius: 4px;'><strong
#>  style='color: #2563eb;'>cuRe Model Selected
#>  <span style='color: #374151;'>The cuRe model incorporates background
#>  mortality rates. Requires the cuRe package. Optionally uses a
#>  background hazard variable (e.g., from life tables). Best suited for
#>  long-term cancer survival studies.
#>
#>  <div style='background-color: #fef2f2; border-left: 4px solid #fca5a5;
#>  padding: 12px; margin: 8px 0; border-radius: 4px;'><strong
#>  style='color: #dc2626;'>Package Missing: cuRe
#>  <span style='color: #374151;'>The cuRe package is required. Install
#>  using: install.packages('cuRe')
#>
#> character(0)
#>
#>  Cure Model Results
#>  ───────────────────────────────────────────────────────────────────────────────────────
#>    Parameter    Estimate    Std. Error    z value    p-value      CI Lower    CI Upper
#>  ───────────────────────────────────────────────────────────────────────────────────────
#>  ───────────────────────────────────────────────────────────────────────────────────────
#>
#>
#>  Cure Fraction Summary
#>  ───────────────────────────────────────────────────────────────────────────────
#>    Group    Cure Fraction    CI Lower    CI Upper    Median Survival (Uncured)
#>  ───────────────────────────────────────────────────────────────────────────────
#>  ───────────────────────────────────────────────────────────────────────────────
#>
#>
#> character(0)
9.3 cuRe Model with Missing Background Hazard Variable
curemodels(
  data = curemodels_test,
  time = "FollowUpMonths",
  status = "Recurrence",
  model_type = "cure",
  use_background_mortality = TRUE
)
#> Error in `curemodels()`:
#> ! argument "predictors" is missing, with no default
This should produce an informative error about requiring the
background_hazard_var.
9.4 npcure Without Covariate
curemodels(
  data = curemodels_test,
  time = "FollowUpMonths",
  status = "Recurrence",
  model_type = "npcure"
)
#> Error in `curemodels()`:
#> ! argument "predictors" is missing, with no default
This should produce an informative error about requiring
npcure_covariate.
9.5 Small Sample
small_data <- curemodels_test[1:20, ]
curemodels(
  data = small_data,
  time = "FollowUpMonths",
  status = "Recurrence",
  model_type = "mixture"
)
#> Error in `curemodels()`:
#> ! argument "predictors" is missing, with no default
Expect warnings about small sample size or potential convergence issues.
10. Clinical Interpretation
The interpretation HTML output provides automatically
generated clinical context for the cure model results. It includes:
- A statement of the estimated cure fraction with confidence interval (when bootstrap is enabled)
- The median survival of uncured patients
- Context based on the cure threshold
- A copy-ready sentence for the Results section of a manuscript
- Clinical recommendations for patient counselling
curemodels(
  data = curemodels_test,
  time = "FollowUpMonths",
  status = "Recurrence",
  predictors = c("Treatment", "Stage"),
  model_type = "mixture",
  smcure_model_type = "ph",
  cure_link = "logit",
  cure_threshold = 60,
  bootstrap_ci = TRUE,
  n_bootstrap = 200,
  plot_cure_fraction = TRUE,
  plot_survival = TRUE,
  goodness_of_fit = TRUE,
  sensitivity_analysis = TRUE
)
#> Program is running..be patient...
#>
#>  CURE MODELS FOR LONG-TERM SURVIVORS
#>
#> character(0)
#>
#>  <div style='background-color: #fff7ed; border-left: 4px solid #fdba74;
#>  padding: 12px; margin: 8px 0; border-radius: 4px;'><strong
#>  style='color: #ea580c;'>Mixture Cure Model Error
#>  <span style='color: #374151;'>Fitting failed: replacement has 500
#>  rows, data has 250
#>
#> character(0)
#>
#> character(0)
#>
#>  Cure Model Results
#>  ───────────────────────────────────────────────────────────────────────────────────────
#>    Parameter    Estimate    Std. Error    z value    p-value      CI Lower    CI Upper
#>  ───────────────────────────────────────────────────────────────────────────────────────
#>  ───────────────────────────────────────────────────────────────────────────────────────
#>
#>
#>  Cure Fraction Summary
#>  ───────────────────────────────────────────────────────────────────────────────
#>    Group    Cure Fraction    CI Lower    CI Upper    Median Survival (Uncured)
#>  ───────────────────────────────────────────────────────────────────────────────
#>  ───────────────────────────────────────────────────────────────────────────────
#>
#>
#>  Goodness of Fit Tests
#>  ────────────────────────────────────────────────────
#>    Test    Statistic    p-value      Interpretation
#>  ────────────────────────────────────────────────────
#>  ────────────────────────────────────────────────────
#>
#>
#>  Sensitivity Analysis
#>
#>  No cure fraction estimate available for sensitivity analysis.
#>
#> character(0)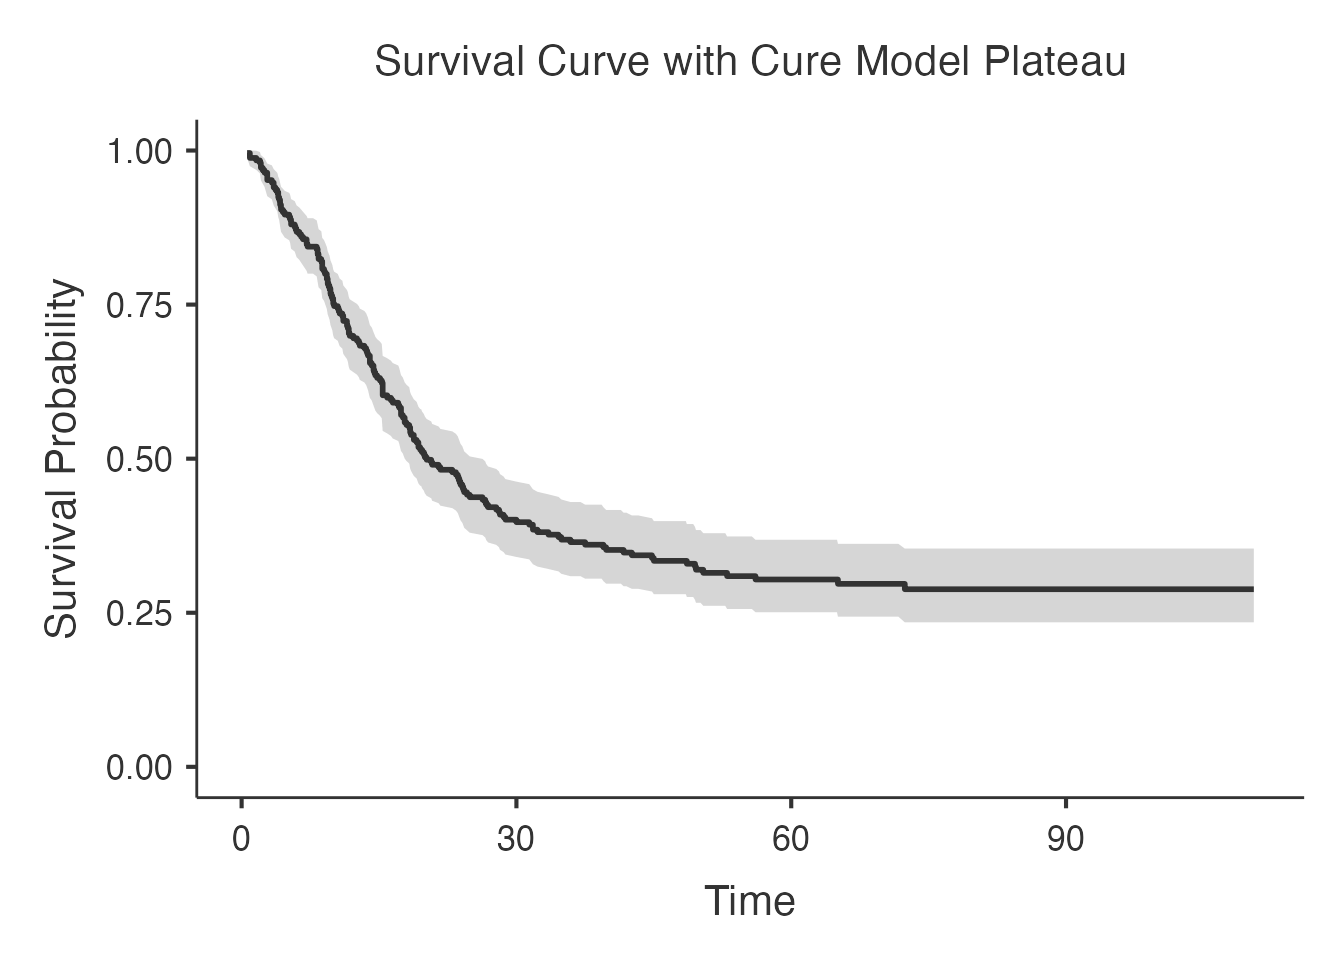
11. References
Berkson J, Gage RP. Survival curve for cancer patients following treatment. J Am Stat Assoc. 1952;47(259):501-515.
Boag JW. Maximum likelihood estimates of the proportion of patients cured by cancer therapy. J R Stat Soc Series B. 1949;11(1):15-53.
Cai C, Zou Y, Peng Y, Zhang J. smcure: An R-package for estimating semiparametric mixture cure models. Comput Methods Programs Biomed. 2012;108(3):1255-1260.
Peng Y, Dear KBG. A nonparametric mixture model for cure rate estimation. Biometrics. 2000;56(1):237-243.
Andersson TML, Dickman PW, Eloranta S, Lambert PC. Estimating and modelling cure in population-based cancer studies within the framework of flexible parametric survival models. BMC Med Res Methodol. 2011;11:96.
Lopez-Cheda A, Cao R, Jacome MA, Van Keilegom I. Nonparametric incidence estimation and bootstrap bandwidth selection in mixture cure models. Comput Stat Data Anal. 2017;105:144-165.
Lambert PC, Thompson JR, Weston CL, Dickman PW. Estimating and modeling the cure fraction in population-based cancer survival analysis. Biostatistics. 2007;8(3):576-594.
Yu B, Tiwari RC, Cronin KA, Feuer EJ. Cure fraction estimation from the mixture cure models for grouped survival data. Stat Med. 2004;23(11):1733-1747.
De Angelis R, Capocaccia R, Hakulinen T, Soderman B, Verdecchia A. Mixture models for cancer survival analysis: application to population-based data with covariates. Stat Med. 1999;18(4):441-454.
Sy JP, Taylor JMG. Estimation in a Cox proportional hazards cure model. Biometrics. 2000;56(1):227-236.