# Create a sample data frame
set.seed(42) # for reproducibility
patient_flow <- data.frame(
  Stage = sample(c("Stage I", "Stage II", "Stage III"), 100, replace = TRUE),
  Treatment = sample(c("Chemo", "Radiation", "Combined"), 100, replace = TRUE),
  Response = sample(c("Complete", "Partial", "None"), 100, replace = TRUE,
                    prob = c(0.4, 0.4, 0.2))
)

# View the first few rows
head(patient_flow)
#>      Stage Treatment Response
#> 1  Stage I     Chemo     None
#> 2  Stage I  Combined Complete
#> 3  Stage I Radiation  Partial
#> 4  Stage I     Chemo     None
#> 5 Stage II     Chemo  Partial
#> 6 Stage II Radiation     None
# This code simulates how the jamovi module would be called in an R environment.
# You would need the ClinicoPathDescriptives package installed.
# Load the library
library(ClinicoPathDescriptives)
#> Registered S3 method overwritten by 'future':
#> method from
#> all.equal.connection parallelly
#> Warning: replacing previous import 'dplyr::select' by 'jmvcore::select' when
#> loading 'ClinicoPathDescriptives'
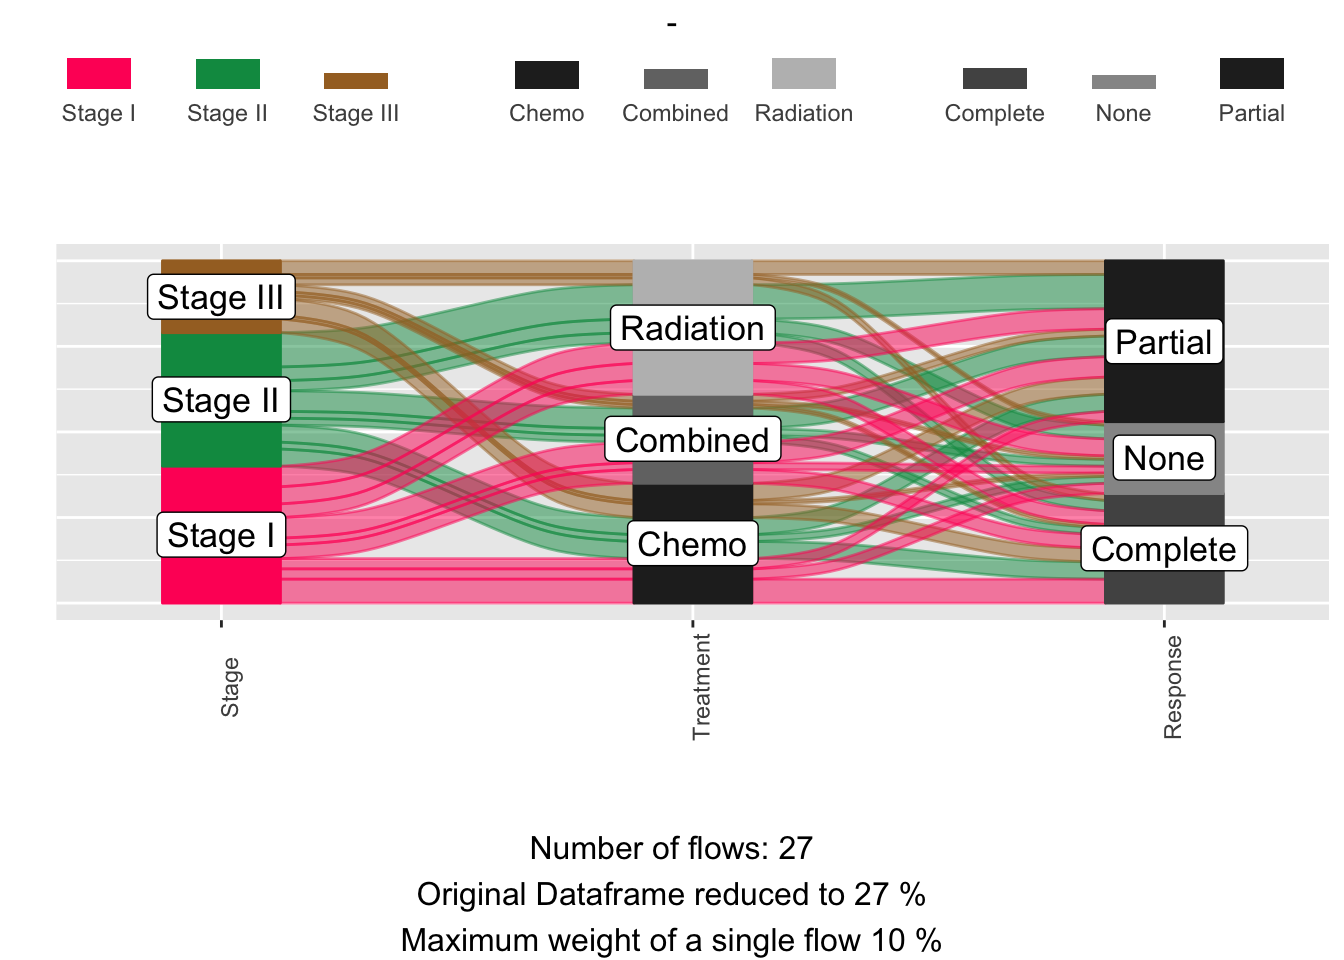
# Run the alluvial analysis
results <- alluvial(
data = patient_flow,
vars = c("Stage", "Treatment", "Response"),
condensationvar = NULL, # No condensation variable
fill = "first_variable", # Color the flows based on initial cancer stage
marg = TRUE # Include marginal histograms
)
#>
|
| | 0%
|
|......................................................................| 100%
# To view the plot:
print(results$plot)
#> [1] "Number of flows: 27"
#> [1] "Original Dataframe reduced to 27 %"
#> [1] "Maximum weight of a single flow 10 %"
#> TableGrob (10 x 1) "arrange": 4 grobs
#>   z         cells    name                grob
#> 1 1 ( 2- 2, 1- 1) arrange     gtable[arrange]
#> 2 2 ( 3- 9, 1- 1) arrange      gtable[layout]
#> 3 3 ( 1- 1, 1- 1) arrange text[GRID.text.221]
#> 4 4 (10-10, 1- 1) arrange text[GRID.text.222]