A dataset containing simulated patient timeline data for clinical oncology research. This dataset represents typical patient journeys through cancer treatment, including diagnosis, treatment, response assessment, and outcomes. The data simulates a realistic clinical study where patients enroll at different timepoints and have varied treatment durations and outcomes.
Format
A data frame with 30 rows and 15 variables:
- PatientID
Patient identifier, formatted as PT001, PT002, etc.
- StartTime
Numeric. Time at which observation began, varies between patients to represent staggered enrollment (some values greater than 0)
- EndTime
Numeric. Time at which observation ended, in the same units as StartTime
- BestResponse
Factor with levels: CR (Complete Response), PR (Partial Response), SD (Stable Disease), PD (Progressive Disease), NE (Not Evaluable)
- Surgery
Numeric. Time of surgery relative to study start. May be negative for surgeries that occurred before enrollment
- TreatmentStart
Numeric. Time when treatment began relative to study start
- ResponseAssessment
Numeric. Time of response assessment relative to study start
- Progression
Numeric. Time of disease progression, NA if no progression
- Death
Numeric. Time of death, NA if patient alive at last follow-up
- Risk
Factor with levels: High, Medium, Low. Risk classification for the patient
- Age
Numeric. Patient age in years
- ECOG
Integer (0-3). ECOG performance status
- ResponseDuration
Numeric. Duration of response, calculated as Progression - ResponseAssessment
- FollowUpDuration
Numeric. Total duration of follow-up, from StartTime to EndTime
Note
There is also a date-based version of this dataset where time variables are represented as actual dates instead of numeric values, named 'patientTimelinesDates'.
Examples
data(patientTimelines)

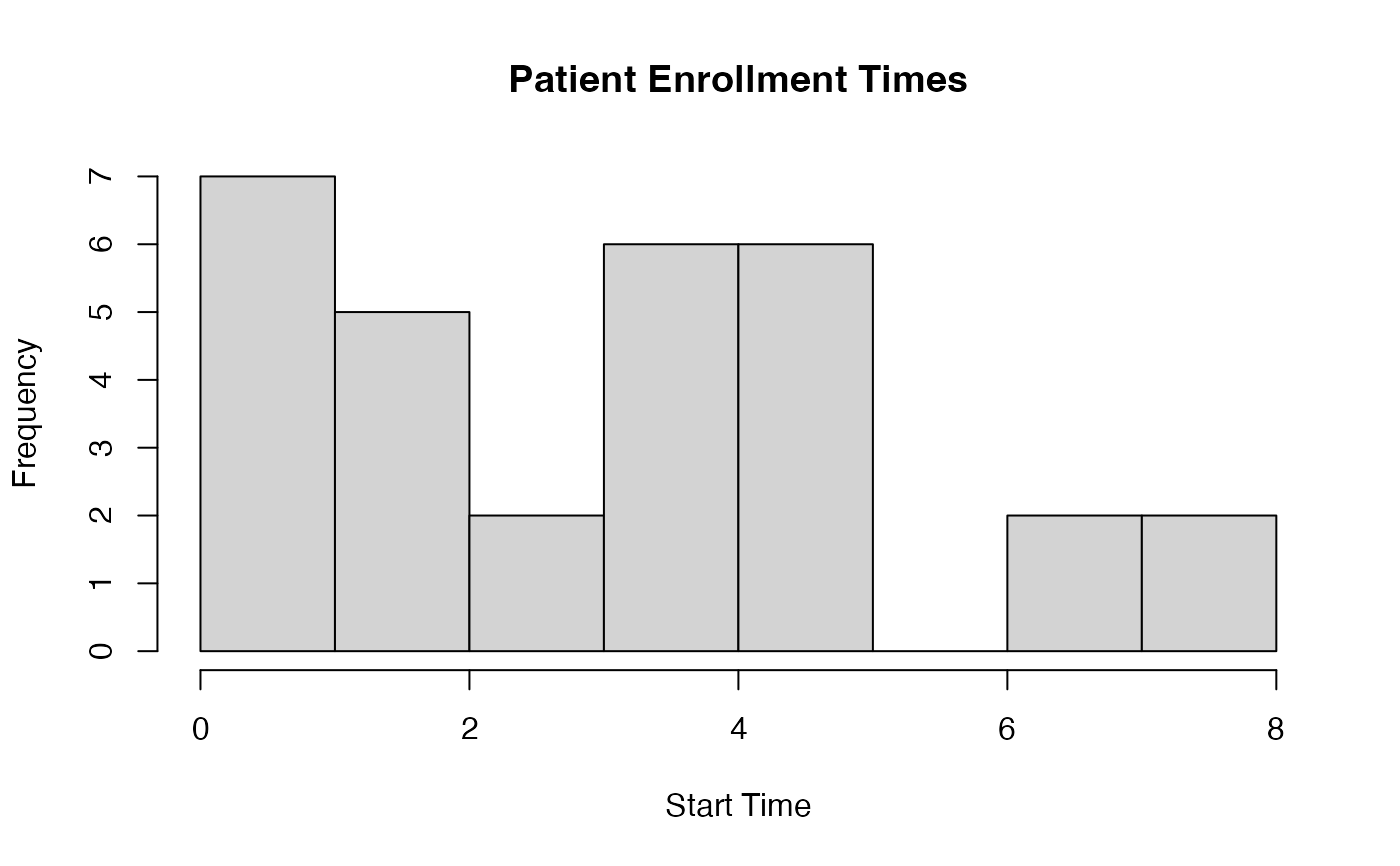
# Show staggered entry of patients into the study
hist(patientTimelines$StartTime,
     main = "Patient Enrollment Times",
     xlab = "Start Time")


# Basic swimmer plot
swimmerplot(
  data = patientTimelines,
  patientID = "PatientID",
  start = "StartTime",
  end = "EndTime",
  event = "BestResponse"
)
#> Error in swimmerplot(data = patientTimelines, patientID = "PatientID",     start = "StartTime", end = "EndTime", event = "BestResponse"): argument "sortVariable" is missing, with no default

# With milestones
swimmerplot(
  data = patientTimelines,
  patientID = "PatientID",
  start = "StartTime",
  end = "EndTime",
  event = "BestResponse",
  milestone1Name = "Surgery",
  milestone1Date = "Surgery",
  milestone2Name = "Treatment",
  milestone2Date = "TreatmentStart"
)
#> Error in swimmerplot(data = patientTimelines, patientID = "PatientID",     start = "StartTime", end = "EndTime", event = "BestResponse",     milestone1Name = "Surgery", milestone1Date = "Surgery", milestone2Name = "Treatment",     milestone2Date = "TreatmentStart"): unused arguments (milestone1Name = "Surgery", milestone1Date = "Surgery", milestone2Name = "Treatment", milestone2Date = "TreatmentStart")