A simulated dataset representing patient responses to cancer treatment. It includes patient identifiers and a numeric value indicating treatment response, likely as a percentage change in tumor size or a similar metric. The data object loaded will be named 'treatmentResponse'.
Usage
data(treatmentResponse)Format
A data frame with 250 rows and 2 variables:
- PatientID
Character. Unique patient identifier (e.g., "PT0001").
- ResponseValue
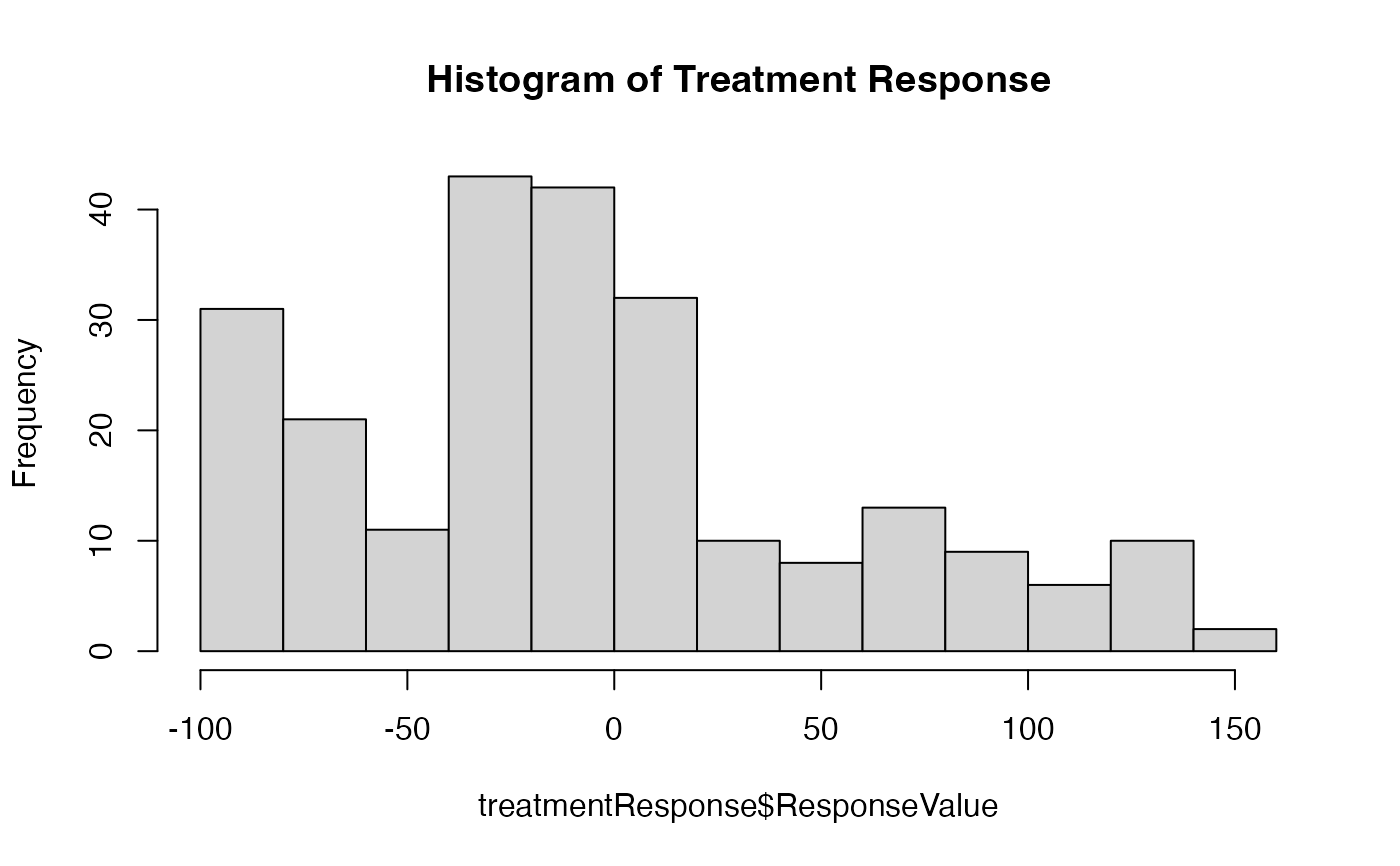
Numeric. A numeric value representing the treatment response. This could be a percentage change from baseline, where negative values typically indicate tumor shrinkage and positive values indicate tumor growth.
Examples
data(treatmentResponse)
str(treatmentResponse)
#> 'data.frame':	250 obs. of  2 variables:
#>  $ PatientID    : chr  "PT0001" "PT0002" "PT0003" "PT0004" ...
#>  $ ResponseValue: num  63.5 -100 -20.5 55.1 -60.5 ...
head(treatmentResponse)
#>   PatientID ResponseValue
#> 1    PT0001          63.5
#> 2    PT0002        -100.0
#> 3    PT0003         -20.5
#> 4    PT0004          55.1
#> 5    PT0005         -60.5
#> 6    PT0006         -93.6
summary(treatmentResponse$ResponseValue)
#>     Min.  1st Qu.   Median     Mean  3rd Qu.     Max.     NA's
#> -100.000  -49.675  -13.300   -6.616   18.900  141.000       12
hist(treatmentResponse$ResponseValue, main="Histogram of Treatment Response")