Comprehensive Swimmer Plot Example Data
Source:R/data_swimmer_unified_docs.R
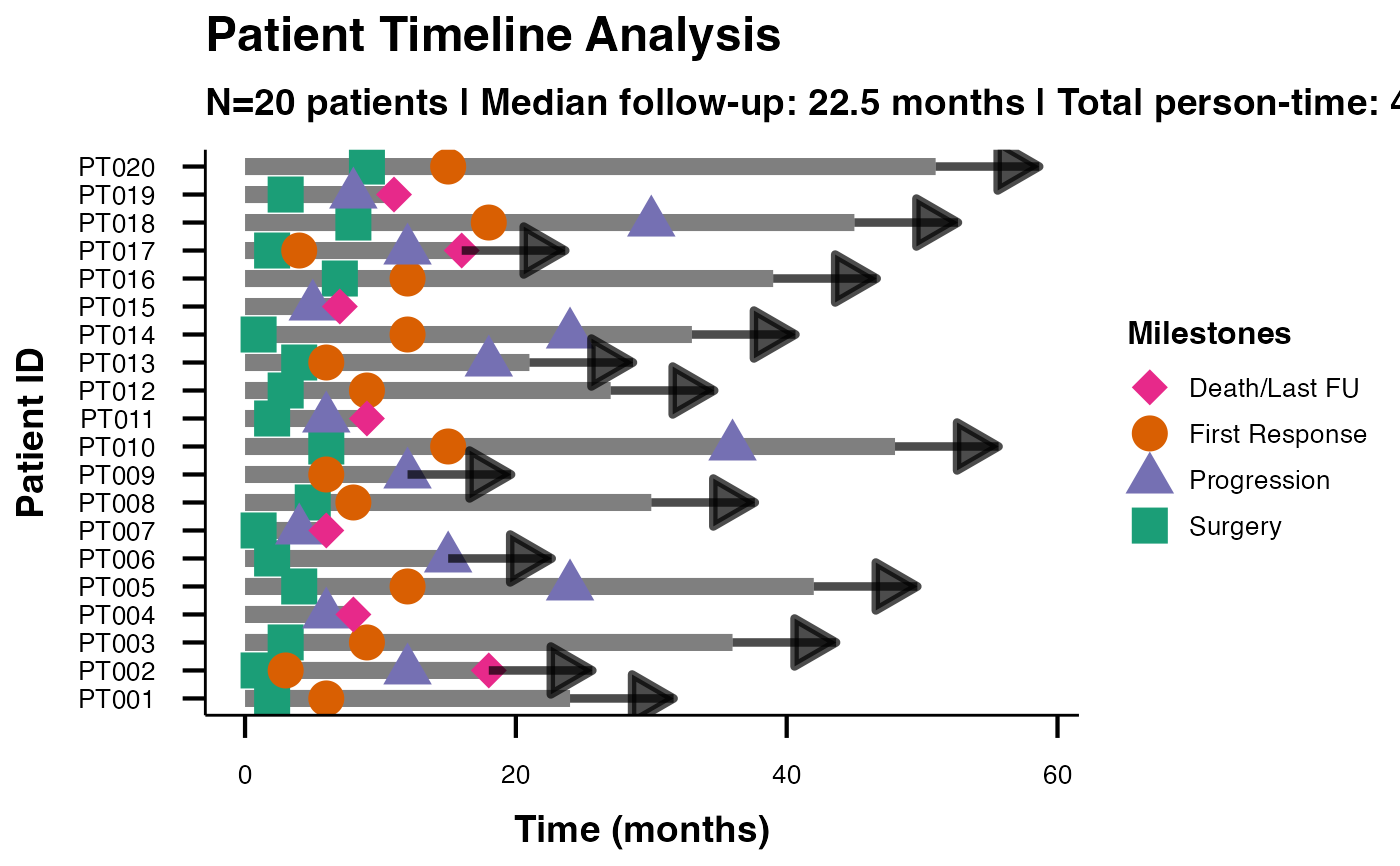
swimmer_unified_comprehensive.RdA comprehensive dataset demonstrating advanced swimmer plot features including multiple milestones, patient demographics, and clinical characteristics. Designed to showcase the full capabilities of the swimmer plot function.
Usage
data(swimmer_unified_comprehensive)Format
A data frame with 20 rows and 11 variables:
- PatientID
Character. Unique patient identifiers (PT001-PT020)
- StartTime
Numeric. Treatment start time (all patients start at 0)
- EndTime
Numeric. Treatment end time in months (6-51 months)
- BestResponse
Character. Best overall response (CR, PR, SD, PD)
- Surgery
Numeric. Time of surgery in months (1-9 months, NA if no surgery)
- FirstResponse
Numeric. Time of first response in months (3-18 months, NA if no response)
- Progression
Numeric. Time of disease progression in months (4-36 months, NA if no progression)
- DeathLastFU
Numeric. Time of death or last follow-up (6-18 months, NA if alive)
- TreatmentType
Character. Type of treatment received
- AgeGroup
Character. Patient age group (Young, Middle, Elderly)
- ECOG
Numeric. ECOG performance status (0, 1, 2)
See also
Other swimmer plot datasets:
swimmer_unified_basic,
swimmer_unified_datetime,
swimmer_unified_events,
swimmer_unified_oncology
Examples
data(swimmer_unified_comprehensive)

# Comprehensive swimmer plot with milestones
swimmerplot(
  data = swimmer_unified_comprehensive,
  patientID = "PatientID",
  startTime = "StartTime",
  endTime = "EndTime",
  responseVar = "BestResponse",
  milestone1Name = "Surgery",
  milestone1Date = "Surgery",
  milestone2Name = "First Response",
  milestone2Date = "FirstResponse",
  milestone3Name = "Progression",
  milestone3Date = "Progression",
  milestone4Name = "Death/Last FU",
  milestone4Date = "DeathLastFU",
  personTimeAnalysis = TRUE,
  showInterpretation = TRUE
)
#>
#>  SWIMMER PLOT
#>
#> character(0)
#>
#>  Timeline Summary Statistics
#>  ───────────────────────────────────
#>    Metric                Value
#>  ───────────────────────────────────
#>    Number of Patients     20.00000
#>    Total Observations     20.00000
#>    Median Duration        22.50000
#>    Mean Duration          24.90000
#>    Total Person-Time     498.00000
#>    Mean Follow-up         24.90000
#>    CR Rate (%)            30.00000
#>    PD Rate (%)            25.00000
#>    PR Rate (%)            25.00000
#>    SD Rate (%)            20.00000
#>  ───────────────────────────────────
#>
#>
#>  <div style='background-color: #e8f5e8; padding: 15px; border-radius:
#>  5px; margin: 10px 0;'>
#>
#>  Clinical Interpretation
#>
#>  <div style='margin: 10px 0;'><h5 style='color: #2e7d32;'>Timeline
#>  Analysis:
#>
#>  Study included 20 patients with 20 timeline observations. Median
#>  follow-up was 22.5 months (range: 6.0 to 51.0 months).
#>
#>  <div style='margin: 10px 0;'><h5 style='color: #2e7d32;'>Person-Time
#>  Analysis:
#>
#>  Total person-time: 498.0 months. Average follow-up per patient: 24.9
#>  months.
#>
#>  <div style='margin: 10px 0;'><h5 style='color: #2e7d32;'>Response
#>  Pattern Analysis:
#>
#>  Most common response was CR (30.0% of observations). Response
#>  distribution shows clinical patterns suitable for efficacy analysis.
#>
#>  Person-Time Analysis
#>  ─────────────────────────────────────────────────────────────────────────────
#>    Response Type    Patients    Total Time    Mean Time    Follow-up Density
#>  ─────────────────────────────────────────────────────────────────────────────
#>    CR                      6     207.00000    34.500000             2.899000
#>    PD                      5      41.00000     8.200000            12.195000
#>    PR                      5     145.00000    29.000000             3.448000
#>    SD                      4     105.00000    26.250000             3.810000
#>  ─────────────────────────────────────────────────────────────────────────────
#>
#>
#>  Milestone Event Summary
#>  ────────────────────────────────────────────────────────────
#>    Milestone         Events    Median Time    Time Range
#>  ────────────────────────────────────────────────────────────
#>    Death/Last FU          7       9.000000    6 - 18 months
#>    First Response        14       9.000000    3 - 18 months
#>    Progression           14      12.000000    4 - 36 months
#>    Surgery               17       3.000000    1 - 9 months
#>  ────────────────────────────────────────────────────────────
#>
#>
#>  Advanced Clinical Metrics
#>  ────────────────────────────────────────────────────────────────────────────────────────────────────────────────────────────────────────────────────────────────
#>    Metric                           Value         95% CI         Unit                 Clinical Interpretation
#>  ────────────────────────────────────────────────────────────────────────────────────────────────────────────────────────────────────────────────────────────────
#>    Median Follow-up Time             22.500000                   months               Central tendency of patient follow-up duration
#>    Interquartile Range               25.000000                   months               Middle 50% of follow-up duration range
#>    Total Study Person-Time          498.000000                   months cumulative    Total observation time across all patients
#>    Follow-up Density                  4.016000                   per 100 months       Number of patients per 100 units of observation time (descriptive metric)
#>    Objective Response Rate (ORR)     55.000000    31.5 - 76.9    percent              Proportion with complete or partial response
#>    Disease Control Rate (DCR)        75.000000    50.9 - 91.3    percent              Proportion with response or stable disease
#>  ────────────────────────────────────────────────────────────────────────────────────────────────────────────────────────────────────────────────────────────────
#>