Event Markers Swimmer Plot Example Data
Source:R/data_swimmer_unified_docs.R
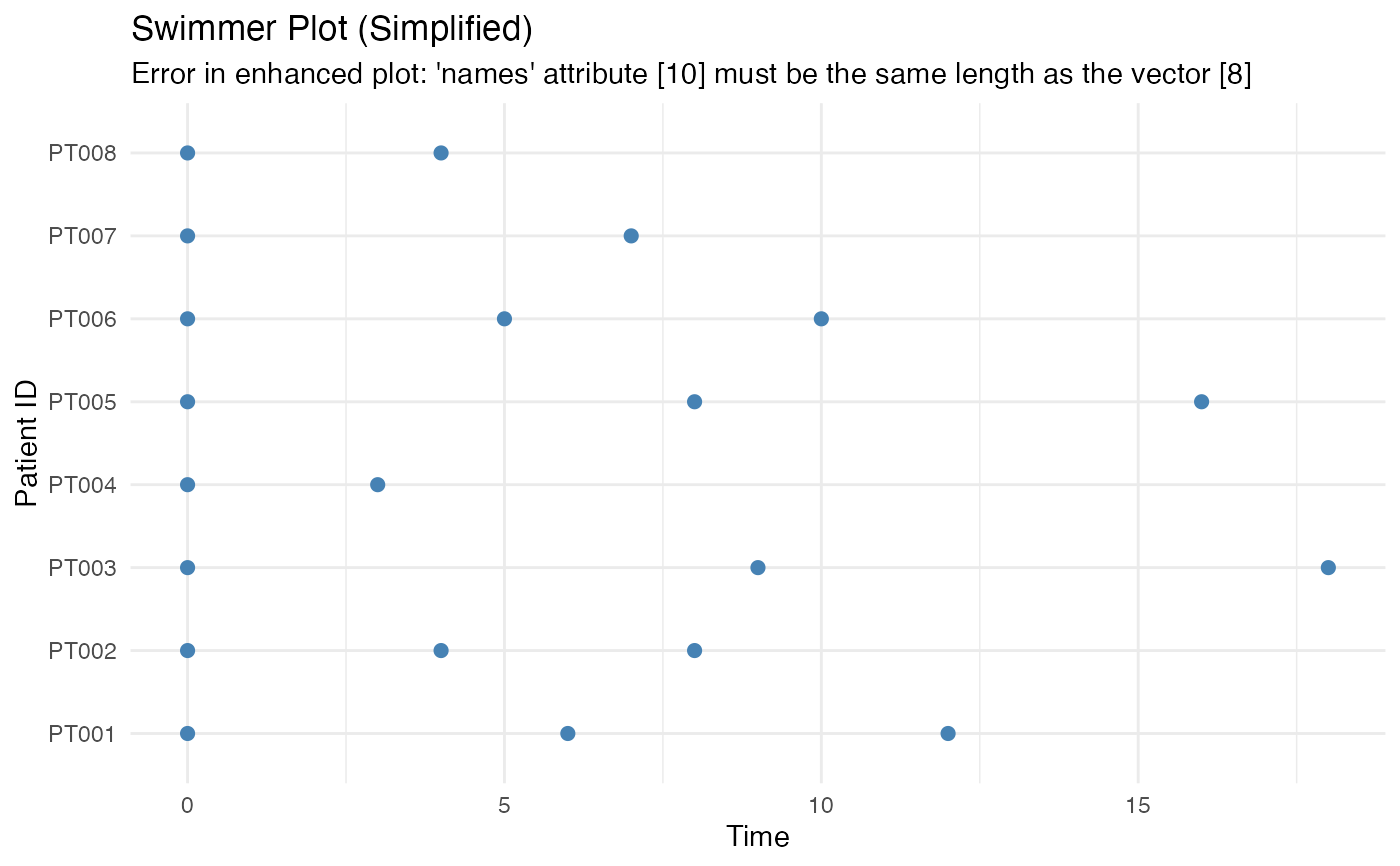
swimmer_unified_events.RdA longitudinal dataset designed to demonstrate event marker functionality. Shows multiple timeline segments per patient with different clinical events, treatments, and adverse event management.
Usage
data(swimmer_unified_events)Format
A data frame with 20 rows and 6 variables:
- PatientID
Character. Patient identifiers (multiple rows per patient)
- StartTime
Numeric. Segment start time in months
- EndTime
Numeric. Segment end time in months
- Response
Character. Response during this segment (CR, PR, SD, PD)
- EventType
Character. Type of clinical event (Treatment Start, Dose Escalation, etc.)
- EventTime
Numeric. Time when the event occurred
See also
Other swimmer plot datasets:
swimmer_unified_basic,
swimmer_unified_comprehensive,
swimmer_unified_datetime,
swimmer_unified_oncology
Examples
data(swimmer_unified_events)

# Event markers swimmer plot
swimmerplot(
  data = swimmer_unified_events,
  patientID = "PatientID",
  startTime = "StartTime",
  endTime = "EndTime",
  responseVar = "Response",
  showEventMarkers = TRUE,
  eventVar = "EventType",
  eventTimeVar = "EventTime",
  markerSize = 6,
  plotTheme = "ggswim"
)
#>
#>  SWIMMER PLOT
#>
#>  <div style='color: #8a6d00; background-color: #fff8e1; padding: 15px;
#>  border: 1px solid #ffc107; border-radius: 5px; margin: 10px;'>
#>
#>  Analysis Information
#>
#>  Found 15 duplicate patient IDs. Multiple episodes per patient detected
#>  - this is normal for longitudinal data.
#>
#>  Timeline Summary Statistics
#>  ───────────────────────────────────
#>    Metric                Value
#>  ───────────────────────────────────
#>    Number of Patients    10.000000
#>    Total Observations    25.000000
#>    Median Duration        9.500000
#>    Mean Duration          9.700000
#>    Total Person-Time     97.000000
#>    Mean Follow-up         9.700000
#>    CR Rate (%)           30.000000
#>    PD Rate (%)           20.000000
#>    PR Rate (%)           30.000000
#>    SD Rate (%)           20.000000
#>  ───────────────────────────────────
#>
#>
#>  <div style='background-color: #e8f5e8; padding: 15px; border-radius:
#>  5px; margin: 10px 0;'>
#>
#>  Clinical Interpretation
#>
#>  <div style='margin: 10px 0;'><h5 style='color: #2e7d32;'>Timeline
#>  Analysis:
#>
#>  Study included 10 patients with 25 timeline observations. Median
#>  follow-up was 9.5 months (range: 5.0 to 15.0 months).
#>
#>  <div style='margin: 10px 0;'><h5 style='color: #2e7d32;'>Person-Time
#>  Analysis:
#>
#>  Total person-time: 97.0 months. Average follow-up per patient: 9.7
#>  months.
#>
#>  <div style='margin: 10px 0;'><h5 style='color: #2e7d32;'>Response
#>  Pattern Analysis:
#>
#>  Most common response was CR (30.0% of observations). Response
#>  distribution shows clinical patterns suitable for efficacy analysis.
#>
#>  Person-Time Analysis
#>  ─────────────────────────────────────────────────────────────────────────────
#>    Response Type    Patients    Total Time    Mean Time    Follow-up Density
#>  ─────────────────────────────────────────────────────────────────────────────
#>    CR                      3      35.00000    11.670000             8.571000
#>    PD                      2      16.00000     8.000000            12.500000
#>    PR                      3      24.00000     8.000000            12.500000
#>    SD                      2      22.00000    11.000000             9.091000
#>  ─────────────────────────────────────────────────────────────────────────────
#>
#>
#>  Milestone Event Summary
#>  ────────────────────────────────────────────────────
#>    Milestone    Events    Median Time    Time Range
#>  ────────────────────────────────────────────────────
#>  ────────────────────────────────────────────────────
#>
#>
#>  Event Marker Summary
#>  ─────────────────────────────────────────────────────────────
#>    Event Type             Count    Percentage    Median Time
#>  ─────────────────────────────────────────────────────────────
#>    Dose Modification          6      24.00000       5.000000
#>    Hospitalization            3      12.00000       5.000000
#>    Response Assessment        5      20.00000       4.000000
#>    Scan                       7      28.00000       4.000000
#>    Toxicity                   4      16.00000       5.000000
#>  ─────────────────────────────────────────────────────────────
#>
#>
#>  Advanced Clinical Metrics
#>  ───────────────────────────────────────────────────────────────────────────────────────────────────────────────────────────────────────────────────────────────
#>    Metric                           Value        95% CI         Unit                 Clinical Interpretation
#>  ───────────────────────────────────────────────────────────────────────────────────────────────────────────────────────────────────────────────────────────────
#>    Median Follow-up Time             9.500000                   months               Central tendency of patient follow-up duration
#>    Interquartile Range               4.500000                   months               Middle 50% of follow-up duration range
#>    Total Study Person-Time          97.000000                   months cumulative    Total observation time across all patients
#>    Follow-up Density                10.309000                   per 100 months       Number of patients per 100 units of observation time (descriptive metric)
#>    Objective Response Rate (ORR)    60.000000    26.2 - 87.8    percent              Proportion with complete or partial response
#>    Disease Control Rate (DCR)       80.000000    44.4 - 97.5    percent              Proportion with response or stable disease
#>  ───────────────────────────────────────────────────────────────────────────────────────────────────────────────────────────────────────────────────────────────
#>