DateTime Swimmer Plot Example Data
Source:R/data_swimmer_unified_docs.R
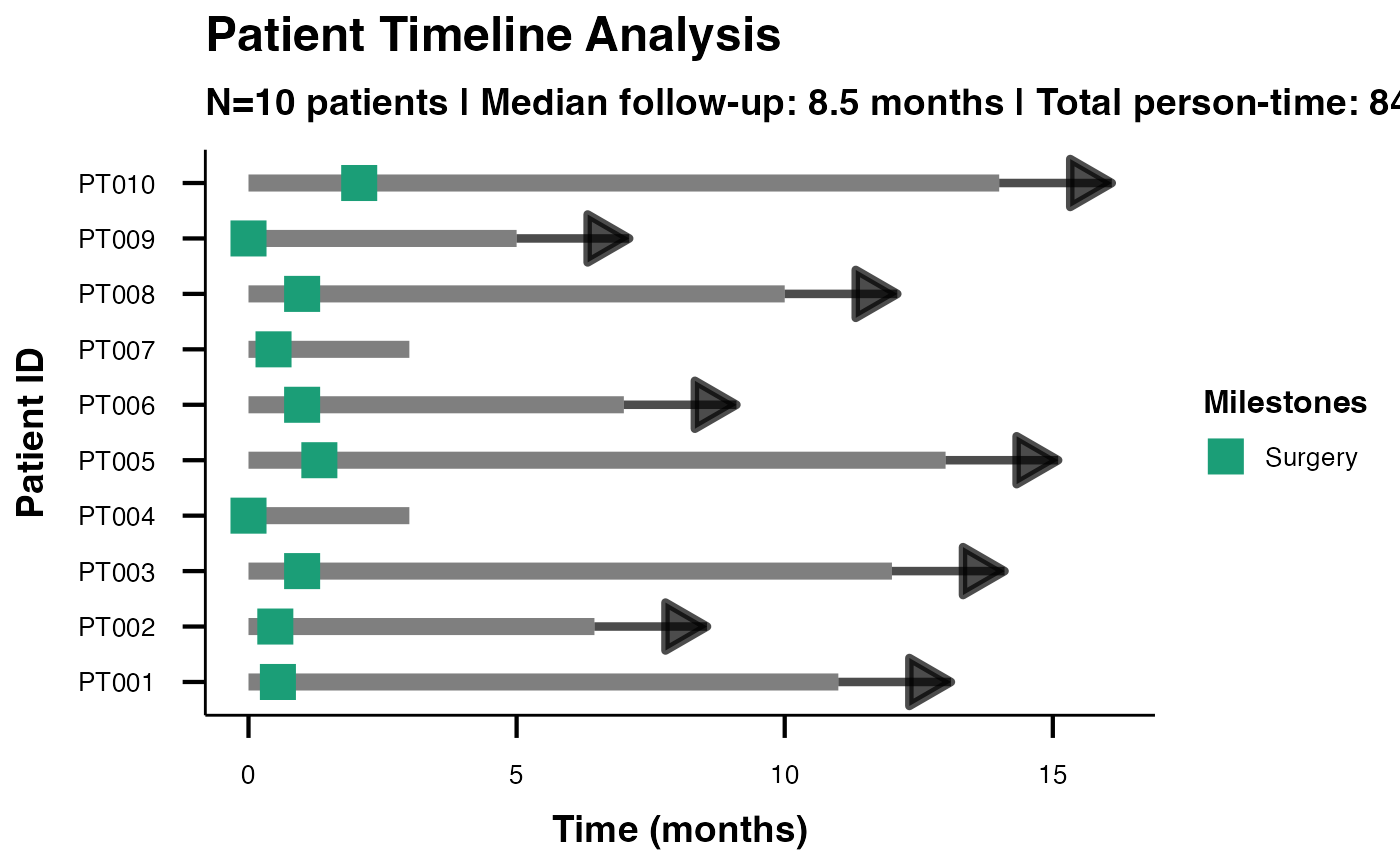
swimmer_unified_datetime.RdA dataset with actual calendar dates to demonstrate datetime handling capabilities of the swimmer plot function. Shows how to work with real-world date formats in clinical data.
Usage
data(swimmer_unified_datetime)Format
A data frame with 10 rows and 6 variables:
- PatientID
Character. Unique patient identifiers (PT001-PT010)
- StartDate
Character. Treatment start date in YYYY-MM-DD format
- EndDate
Character. Treatment end date in YYYY-MM-DD format
- BestResponse
Character. Best overall response (CR, PR, SD, PD)
- SurgeryDate
Character. Surgery date in YYYY-MM-DD format (NA if no surgery)
- ProgressionDate
Character. Date of progression assessment (NA if no progression)
See also
Other swimmer plot datasets:
swimmer_unified_basic,
swimmer_unified_comprehensive,
swimmer_unified_events,
swimmer_unified_oncology
Examples
data(swimmer_unified_datetime)

# DateTime swimmer plot with relative display
swimmerplot(
  data = swimmer_unified_datetime,
  patientID = "PatientID",
  startTime = "StartDate",
  endTime = "EndDate",
  responseVar = "BestResponse",
  timeType = "datetime",
  dateFormat = "ymd",
  timeUnit = "months",
  timeDisplay = "relative",
  milestone1Name = "Surgery",
  milestone1Date = "SurgeryDate"
)
#>
#>  SWIMMER PLOT
#>
#>  <div style='color: #8a6d00; background-color: #fff8e1; padding: 15px;
#>  border: 1px solid #ffc107; border-radius: 5px; margin: 10px;'>
#>
#>  Analysis Information
#>
#>  Some response categories have <3 patients. Consider grouping
#>  categories for meaningful analysis.
#>
#>  Timeline Summary Statistics
#>  ───────────────────────────────────
#>    Metric                Value
#>  ───────────────────────────────────
#>    Number of Patients     15.00000
#>    Total Observations     15.00000
#>    Median Duration        11.81000
#>    Mean Duration          12.60000
#>    Total Person-Time     188.93000
#>    Mean Follow-up         12.60000
#>    CR Rate (%)            33.30000
#>    PD Rate (%)            13.30000
#>    PR Rate (%)            33.30000
#>    SD Rate (%)            20.00000
#>  ───────────────────────────────────
#>
#>
#>  <div style='background-color: #e8f5e8; padding: 15px; border-radius:
#>  5px; margin: 10px 0;'>
#>
#>  Clinical Interpretation
#>
#>  <div style='margin: 10px 0;'><h5 style='color: #2e7d32;'>Timeline
#>  Analysis:
#>
#>  Study included 15 patients with 15 timeline observations. Median
#>  follow-up was 11.8 months (range: 6.0 to 21.7 months).
#>
#>  <div style='margin: 10px 0;'><h5 style='color: #2e7d32;'>Person-Time
#>  Analysis:
#>
#>  Total person-time: 188.9 months. Average follow-up per patient: 12.6
#>  months.
#>
#>  <div style='margin: 10px 0;'><h5 style='color: #2e7d32;'>Response
#>  Pattern Analysis:
#>
#>  Most common response was CR (33.3% of observations). Response
#>  distribution shows clinical patterns suitable for efficacy analysis.
#>
#>  Person-Time Analysis
#>  ─────────────────────────────────────────────────────────────────────────────
#>    Response Type    Patients    Total Time    Mean Time    Follow-up Density
#>  ─────────────────────────────────────────────────────────────────────────────
#>    CR                      5      72.92000    14.580000             6.857000
#>    PD                      2      12.84000     6.420000            15.578000
#>    PR                      5      65.88000    13.180000             7.589000
#>    SD                      3      37.29000    12.430000             8.045000
#>  ─────────────────────────────────────────────────────────────────────────────
#>
#>
#>  Milestone Event Summary
#>  ────────────────────────────────────────────────────
#>    Milestone    Events    Median Time    Time Range
#>  ────────────────────────────────────────────────────
#>  ────────────────────────────────────────────────────
#>
#>
#>  Advanced Clinical Metrics
#>  ────────────────────────────────────────────────────────────────────────────────────────────────────────────────────────────────────────────────────────────────
#>    Metric                           Value         95% CI         Unit                 Clinical Interpretation
#>  ────────────────────────────────────────────────────────────────────────────────────────────────────────────────────────────────────────────────────────────────
#>    Median Follow-up Time             11.810000                   months               Central tendency of patient follow-up duration
#>    Interquartile Range                5.930000                   months               Middle 50% of follow-up duration range
#>    Total Study Person-Time          188.930000                   months cumulative    Total observation time across all patients
#>    Follow-up Density                  7.939000                   per 100 months       Number of patients per 100 units of observation time (descriptive metric)
#>    Objective Response Rate (ORR)     66.700000    38.4 - 88.2    percent              Proportion with complete or partial response
#>    Disease Control Rate (DCR)        86.700000    59.5 - 98.3    percent              Proportion with response or stable disease
#>  ────────────────────────────────────────────────────────────────────────────────────────────────────────────────────────────────────────────────────────────────
#>