Oncology Clinical Trial Swimmer Plot Data
Source:R/data_swimmer_unified_docs.R
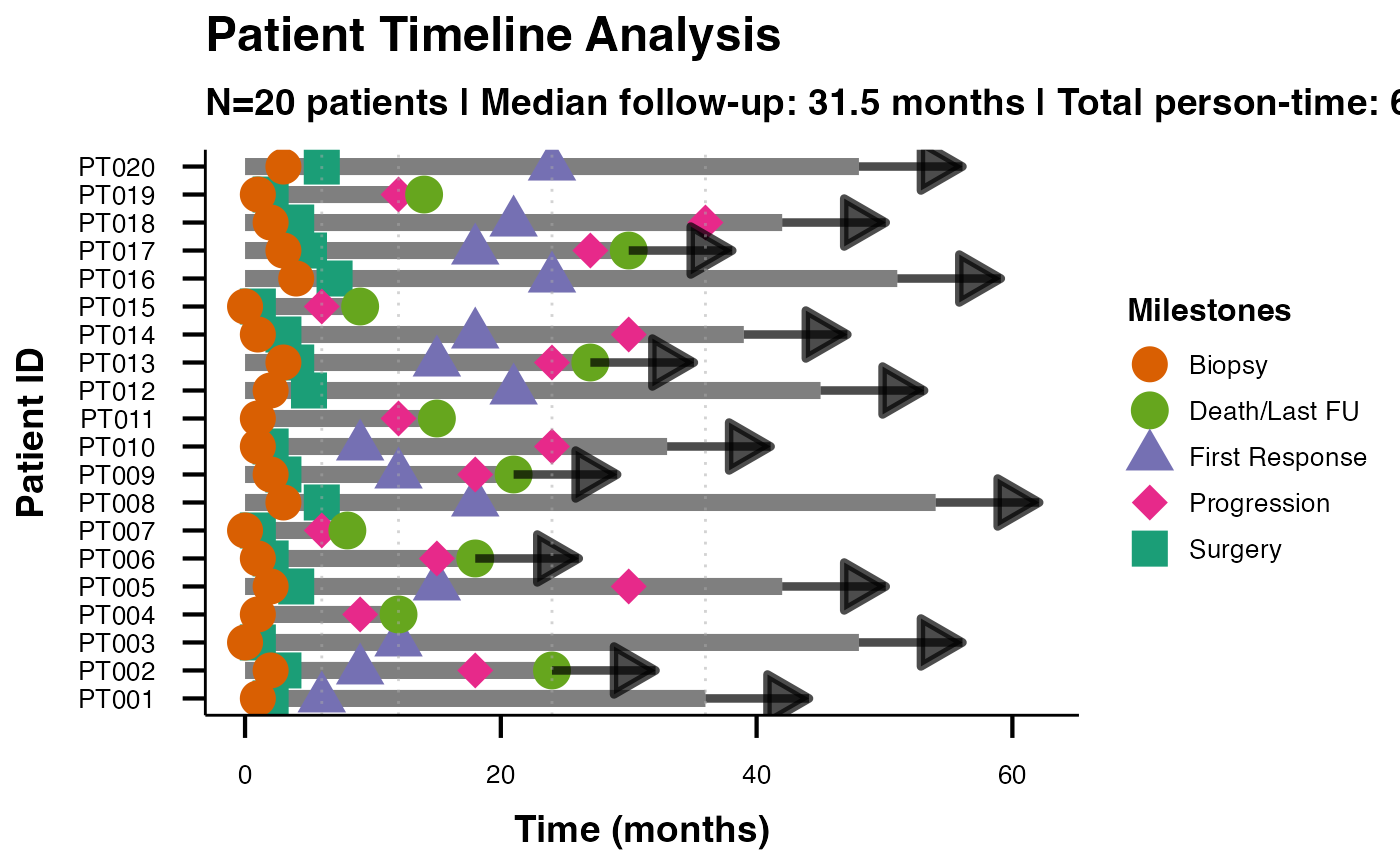
swimmer_unified_oncology.RdA realistic oncology clinical trial dataset demonstrating comprehensive swimmer plot analysis for regulatory submissions. Includes detailed clinical milestones, tumor characteristics, and demographic information.
Usage
data(swimmer_unified_oncology)Format
A data frame with 20 rows and 14 variables:
- PatientID
Character. Unique patient identifiers (PT001-PT020)
- StartTime
Numeric. Treatment start time (all patients start at 0)
- EndTime
Numeric. Treatment end time in months (8-54 months)
- BestResponse
Character. Best overall response per RECIST (CR, PR, SD, PD)
- Baseline
Numeric. Baseline assessment time
- FirstAssessment
Numeric. Time of first assessment in months
- BestResponseTime
Numeric. Time of best response in months
- Progression
Numeric. Time of disease progression (NA if no progression)
- Death
Numeric. Time of death (NA if alive)
- Stage
Character. Disease stage
- Arm
Character. Treatment arm
- Site
Character. Clinical trial site
- Age
Numeric. Patient age
- Gender
Character. Patient gender
See also
Other swimmer plot datasets:
swimmer_unified_basic,
swimmer_unified_comprehensive,
swimmer_unified_datetime,
swimmer_unified_events
Examples
data(swimmer_unified_oncology)

# Comprehensive oncology swimmer plot
swimmerplot(
  data = swimmer_unified_oncology,
  patientID = "PatientID",
  startTime = "StartTime",
  endTime = "EndTime",
  responseVar = "BestResponse",
  milestone1Name = "Baseline",
  milestone1Date = "Baseline",
  milestone2Name = "First Assessment",
  milestone2Date = "FirstAssessment",
  milestone3Name = "Best Response",
  milestone3Date = "BestResponseTime",
  milestone4Name = "Progression",
  milestone4Date = "Progression",
  milestone5Name = "Death",
  milestone5Date = "Death",
  referenceLines = "protocol",
  showInterpretation = TRUE,
  personTimeAnalysis = TRUE,
  responseAnalysis = TRUE,
  plotTheme = "ggswim",
  sortOrder = "duration_desc"
)
#>
#>  SWIMMER PLOT
#>
#> character(0)
#>
#>  Timeline Summary Statistics
#>  ───────────────────────────────────
#>    Metric                Value
#>  ───────────────────────────────────
#>    Number of Patients     30.00000
#>    Total Observations     30.00000
#>    Median Duration        26.00000
#>    Mean Duration          24.90000
#>    Total Person-Time     747.00000
#>    Mean Follow-up         24.90000
#>    CR Rate (%)            23.30000
#>    PD Rate (%)            26.70000
#>    PR Rate (%)            26.70000
#>    SD Rate (%)            23.30000
#>  ───────────────────────────────────
#>
#>
#>  <div style='background-color: #e8f5e8; padding: 15px; border-radius:
#>  5px; margin: 10px 0;'>
#>
#>  Clinical Interpretation
#>
#>  <div style='margin: 10px 0;'><h5 style='color: #2e7d32;'>Timeline
#>  Analysis:
#>
#>  Study included 30 patients with 30 timeline observations. Median
#>  follow-up was 26.0 months (range: 8.0 to 45.0 months).
#>
#>  <div style='margin: 10px 0;'><h5 style='color: #2e7d32;'>Person-Time
#>  Analysis:
#>
#>  Total person-time: 747.0 months. Average follow-up per patient: 24.9
#>  months.
#>
#>  <div style='margin: 10px 0;'><h5 style='color: #2e7d32;'>Response
#>  Pattern Analysis:
#>
#>  Most common response was PD (26.7% of observations). Response
#>  distribution shows clinical patterns suitable for efficacy analysis.
#>
#>  Person-Time Analysis
#>  ─────────────────────────────────────────────────────────────────────────────
#>    Response Type    Patients    Total Time    Mean Time    Follow-up Density
#>  ─────────────────────────────────────────────────────────────────────────────
#>    CR                      7      208.0000     29.71000             3.365000
#>    PD                      8      191.0000     23.88000             4.188000
#>    PR                      8      191.0000     23.88000             4.188000
#>    SD                      7      157.0000     22.43000             4.459000
#>  ─────────────────────────────────────────────────────────────────────────────
#>
#>
#>  Milestone Event Summary
#>  ───────────────────────────────────────────────────────────────
#>    Milestone           Events    Median Time    Time Range
#>  ───────────────────────────────────────────────────────────────
#>    Baseline                30       0.000000    0 - 0 months
#>    Best Response           30      17.500000    8 - 24 months
#>    Death                    3      17.000000    13 - 40 months
#>    First Assessment        30       8.000000    8 - 8 months
#>    Progression             14      23.500000    9 - 36 months
#>  ───────────────────────────────────────────────────────────────
#>
#>
#>  Advanced Clinical Metrics
#>  ────────────────────────────────────────────────────────────────────────────────────────────────────────────────────────────────────────────────────────────────
#>    Metric                           Value         95% CI         Unit                 Clinical Interpretation
#>  ────────────────────────────────────────────────────────────────────────────────────────────────────────────────────────────────────────────────────────────────
#>    Median Follow-up Time             26.000000                   months               Central tendency of patient follow-up duration
#>    Interquartile Range               20.500000                   months               Middle 50% of follow-up duration range
#>    Total Study Person-Time          747.000000                   months cumulative    Total observation time across all patients
#>    Follow-up Density                  4.016000                   per 100 months       Number of patients per 100 units of observation time (descriptive metric)
#>    Objective Response Rate (ORR)     50.000000    31.3 - 68.7    percent              Proportion with complete or partial response
#>    Disease Control Rate (DCR)        73.300000    54.1 - 87.7    percent              Proportion with response or stable disease
#>  ────────────────────────────────────────────────────────────────────────────────────────────────────────────────────────────────────────────────────────────────
#>