Use ClinicoPathDescriptives in R
ClinicoPath Development Team
2025-06-30
Source:vignettes/general-16-use-clinicopath-in-r.Rmd
general-16-use-clinicopath-in-r.Rmd
library(ClinicoPath)
#> Registered S3 method overwritten by 'future':
#>   method               from
#>   all.equal.connection parallelly
#> Warning: replacing previous import 'dplyr::select' by 'jmvcore::select' when
#> loading 'ClinicoPath'
#> Warning: replacing previous import 'cutpointr::roc' by 'pROC::roc' when loading
#> 'ClinicoPath'
#> Warning: replacing previous import 'cutpointr::auc' by 'pROC::auc' when loading
#> 'ClinicoPath'
#> Warning: replacing previous import 'magrittr::extract' by 'tidyr::extract' when
#> loading 'ClinicoPath'
#> Warning in check_dep_version(): ABI version mismatch:
#> lme4 was built with Matrix ABI version 1
#> Current Matrix ABI version is 0
#> Please re-install lme4 from source or restore original 'Matrix' package
#> Warning: replacing previous import 'jmvcore::select' by 'dplyr::select' when
#> loading 'ClinicoPath'
#> Registered S3 methods overwritten by 'ggpp':
#>   method                  from
#>   heightDetails.titleGrob ggplot2
#>   widthDetails.titleGrob  ggplot2
#> Warning: replacing previous import 'DataExplorer::plot_histogram' by
#> 'grafify::plot_histogram' when loading 'ClinicoPath'
#> Warning: replacing previous import 'ROCR::plot' by 'graphics::plot' when
#> loading 'ClinicoPath'
#> Warning: replacing previous import 'dplyr::select' by 'jmvcore::select' when
#> loading 'ClinicoPath'
#> Warning: replacing previous import 'tibble::view' by 'summarytools::view' when
#> loading 'ClinicoPath'
data("histopathology")
dplyr::glimpse(histopathology)
#> Rows: 250
#> Columns: 38
#> $ ID                   <dbl> 1, 2, 3, 4, 5, 6, 7, 8, 9, 10, 11, 12, 13, 14, 15…
#> $ Name                 <chr> "Tonisia", "Daniyah", "Naviana", "Daerion", "Tamy…
#> $ Sex                  <chr> "Male", "Female", "Male", "Male", "Female", "Fema…
#> $ Age                  <dbl> 27, 36, 65, 51, 58, 53, 33, 26, 25, 68, 34, 45, 3…
#> $ Race                 <chr> "White", "White", "White", "White", "Black", "Whi…
#> $ PreinvasiveComponent <chr> "Present", "Absent", "Absent", "Absent", "Absent"…
#> $ LVI                  <chr> "Present", "Absent", "Absent", "Present", "Absent…
#> $ PNI                  <chr> "Absent", "Absent", "Absent", "Absent", "Absent",…
#> $ LastFollowUpDate     <chr> "2019.10.22 00:00:00", "2019.06.22 00:00:00", "20…
#> $ Death                <chr> "YANLIŞ", "DOĞRU", "DOĞRU", "YANLIŞ", "YANLIŞ", "…
#> $ Group                <chr> "Control", "Treatment", "Control", "Treatment", "…
#> $ Grade                <dbl> 2, 2, 1, 3, 2, 2, 1, 2, 3, 3, 3, 1, 1, 1, 2, 1, 2…
#> $ TStage               <dbl> 4, 4, 4, 4, 1, 4, 2, 3, 4, 4, 3, 2, 2, 2, 4, 4, 2…
#> $ `Anti-X-intensity`   <dbl> 3, 2, 2, 3, 3, 3, 2, 2, 1, 2, 3, 3, 3, 1, 3, 3, 3…
#> $ `Anti-Y-intensity`   <dbl> 1, 1, 2, 3, 3, 2, 2, 2, 1, 3, 1, 2, 2, 2, 2, 3, 2…
#> $ LymphNodeMetastasis  <chr> "Present", "Absent", "Absent", "Absent", "Absent"…
#> $ Valid                <chr> "YANLIŞ", "DOĞRU", "YANLIŞ", "DOĞRU", "DOĞRU", "D…
#> $ Smoker               <chr> "YANLIŞ", "YANLIŞ", "DOĞRU", "YANLIŞ", "DOĞRU", "…
#> $ Grade_Level          <chr> "high", "low", "low", "high", "low", "moderate", …
#> $ SurgeryDate          <chr> "2019.07.08 00:00:00", "2019.03.18 00:00:00", "20…
#> $ DeathTime            <chr> "Within1Year", "Within1Year", "Within1Year", "Wit…
#> $ int                  <chr> "2019-07-08 UTC--2019-10-22 UTC", "2019-03-18 UTC…
#> $ OverallTime          <dbl> 3.5, 3.1, 3.1, 4.9, 3.3, 9.3, 6.3, 9.0, 5.8, 9.9,…
#> $ Outcome              <dbl> 0, 1, 1, 0, 0, 0, 1, 1, 1, 0, 1, 1, 1, 1, 1, 0, N…
#> $ Mortality5yr         <chr> "Alive", "Dead", "Dead", "Alive", "Alive", "Alive…
#> $ `Rater 1`            <dbl> 0, 1, 1, 0, 0, 0, 1, 1, 1, 0, 1, 1, 1, 1, 1, 0, N…
#> $ `Rater 2`            <dbl> 0, 0, 0, 0, 0, 0, 0, 0, 0, 0, 0, 0, 0, 0, 0, 0, 0…
#> $ `Rater 3`            <dbl> 1, 1, 1, 0, 1, 1, 1, 1, 1, 1, 1, 1, 1, 1, 1, 0, 1…
#> $ `Rater A`            <dbl> 3, 2, 3, 3, 2, 3, 1, 1, 2, 1, 1, 3, 3, 1, 3, 2, 3…
#> $ `Rater B`            <dbl> 3, 2, 3, 3, 2, 3, 1, 1, 2, 1, 1, 3, 3, 1, 3, 2, 3…
#> $ `New Test`           <dbl> 0, 0, 0, 0, 0, 0, 1, 0, 0, 0, 1, 0, 0, 1, 0, 1, 1…
#> $ `Golden Standart`    <dbl> 0, 0, 0, 0, 0, 0, 0, 0, 0, 0, 1, 0, 0, 1, 0, 0, 1…
#> $ MeasurementA         <dbl> -1.634318251, 0.370706042, 0.015853764, -1.235844…
#> $ MeasurementB         <dbl> 0.611415041, 0.554385763, 0.742388876, 0.62184265…
#> $ `Disease Status`     <chr> "Ill", "Ill", "Healthy", "Ill", "Healthy", "Ill",…
#> $ Measurement1         <dbl> 0.38663133, 0.82938032, 0.15875305, 2.44735406, 0…
#> $ Measurement2         <dbl> 1.86537533, 0.54248017, 0.07008299, 2.40713373, 0…
#> $ Outcome2             <chr> "DOD", "DOOC", "AWD", "AWOD", "DOD", "DOOC", "AWD…
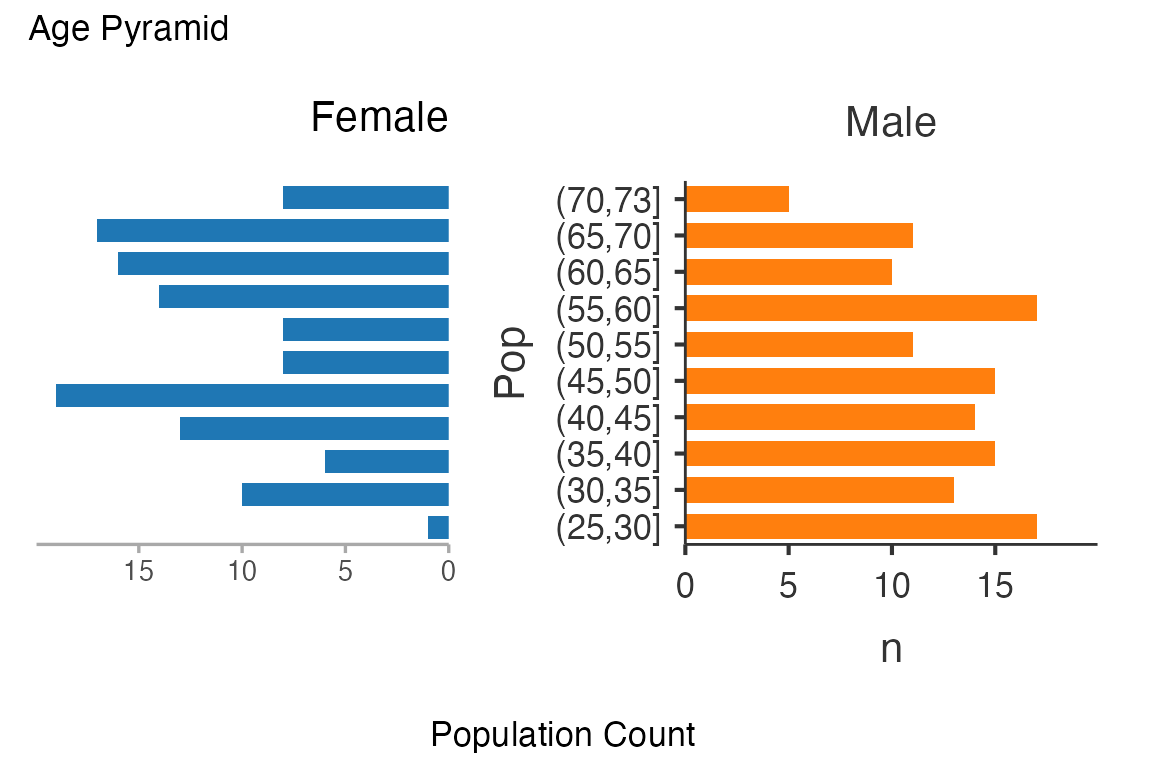
ClinicoPath::agepyramid(
    data = histopathology,
    age = Age,
    gender = Sex,
    female = "Female")
#>
#>  AGE PYRAMID
#>
#>  Population Data
#>  ────────────────────────────────
#>    Population    Female    Male
#>  ────────────────────────────────
#>    (70,73]            8       5
#>    (65,70]           17      11
#>    (60,65]           16      10
#>    (55,60]           14      17
#>    (50,55]            8      11
#>    (45,50]            8      15
#>    (40,45]           19      14
#>    (35,40]           13      15
#>    (30,35]            6      13
#>    (25,30]           10      17
#>    (20,25]            1       0
#>  ────────────────────────────────
age_pyramid <-
ClinicoPath::agepyramid(
    data = histopathology,
    age = Age,
    gender = Sex,
    female = "Female")
age_pyramid$pyramidTable
#>
#>  Population Data
#>  ────────────────────────────────
#>    Population    Female    Male
#>  ────────────────────────────────
#>    (70,73]            8       5
#>    (65,70]           17      11
#>    (60,65]           16      10
#>    (55,60]           14      17
#>    (50,55]            8      11
#>    (45,50]            8      15
#>    (40,45]           19      14
#>    (35,40]           13      15
#>    (30,35]            6      13
#>    (25,30]           10      17
#>    (20,25]            1       0
#>  ────────────────────────────────
age_pyramid$pyramidTable$asDF
#>        Pop Female Male
#> 1  (70,73]      8    5
#> 2  (65,70]     17   11
#> 3  (60,65]     16   10
#> 4  (55,60]     14   17
#> 5  (50,55]      8   11
#> 6  (45,50]      8   15
#> 7  (40,45]     19   14
#> 8  (35,40]     13   15
#> 9  (30,35]      6   13
#> 10 (25,30]     10   17
#> 11 (20,25]      1    0
age_pyramid$plot
age_pyramid$plot$state
#> # A tibble: 21 × 3
#>    Gender Pop         n
#>    <chr>  <ord>   <int>
#>  1 Female (20,25]     1
#>  2 Female (25,30]    10
#>  3 Female (30,35]     6
#>  4 Female (35,40]    13
#>  5 Female (40,45]    19
#>  6 Female (45,50]     8
#>  7 Female (50,55]     8
#>  8 Female (55,60]    14
#>  9 Female (60,65]    16
#> 10 Female (65,70]    17
#> # ℹ 11 more rows
age_pyramid$plot$plot
temp_file_png <- tempfile(fileext = ".png")
age_pyramid$plot$saveAs(paste0(temp_file_png, ".png"))
#> [1] TRUE

age_pyramid_plot <- png::readPNG(paste0(temp_file_png, ".png"))

temp_file_tiff <- tempfile(fileext = ".tiff")

tiff::writeTIFF(what = age_pyramid_plot,
                where = paste0(temp_file_tiff, ".tiff"),
                compression = "LZW")
#> [1] 1| |Pop | Female| Male| | |:——-|——:|—-:| | |(70,73] | 8| 5| | |(65,70] | 17| 11| | |(60,65] | 16| 10| | |(55,60] | 14| 17| | |(50,55] | 8| 11| | |(45,50] | 8| 15| | |(40,45] | 19| 14| | |(35,40] | 13| 15| | |(30,35] | 6| 13| | |(25,30] | 10| 17| | |(20,25] | 1| 0| |
Age Pyramid
agepyramidClass
Age Pyramid
alluvial()
Alluvial Diagrams
alluvialClass
Alluvial Plot
benford()
Benford Analysis
crosstable()
Cross Tables
crosstableClass
Cross Table
histopathology
histopathology
reportcat()
Summary of Categorical Variables
reportcatClass
Summary of Categorical Variables
summarydata()
Summary of Continuous Variables
summarydataClass
Summary of Continuous Variables
tableone()
Table One
tableoneClass
Table One
venn()
Venn Diagram
vennClass