# For vignette demonstration, ensure 'treatmentResponse' is available.
# This data is part of the ClinicoPathDescriptives package.
data(treatmentResponse, package = "ClinicoPathDescriptives")
if (!exists("treatmentResponse")) {
  set.seed(123)

  # Step 1: Create the data frame with the first two columns.
  treatmentResponse <- data.frame(
    patientID = 1:50,
    change = round(c(rnorm(25, -40, 20), rnorm(25, 20, 25)))
  )

  # Step 2: Now that 'treatmentResponse$change' exists, create the responseCategory column.
  treatmentResponse$responseCategory <- factor(
    ifelse(treatmentResponse$change <= -30, "Partial Response",
      ifelse(treatmentResponse$change >= 20, "Progressive Disease", "Stable Disease")
    )
  )
}
head(treatmentResponse)
#>   patientID change responseCategory
#> 1         1    -51 Partial Response
#> 2         2    -45 Partial Response
#> 3         3     -9   Stable Disease
#> 4         4    -39 Partial Response
#> 5         5    -37 Partial Response
#> 6         6     -6   Stable Disease
library(ClinicoPath)
#> Registered S3 method overwritten by 'future':
#> method from
#> all.equal.connection parallelly
#> Warning: replacing previous import 'dplyr::select' by 'jmvcore::select' when
#> loading 'ClinicoPath'
#> Warning: replacing previous import 'cutpointr::roc' by 'pROC::roc' when loading
#> 'ClinicoPath'
#> Warning: replacing previous import 'cutpointr::auc' by 'pROC::auc' when loading
#> 'ClinicoPath'
#> Warning: replacing previous import 'magrittr::extract' by 'tidyr::extract' when
#> loading 'ClinicoPath'
#> Warning in check_dep_version(): ABI version mismatch:
#> lme4 was built with Matrix ABI version 1
#> Current Matrix ABI version is 0
#> Please re-install lme4 from source or restore original 'Matrix' package
#> Warning: replacing previous import 'jmvcore::select' by 'dplyr::select' when
#> loading 'ClinicoPath'
#> Registered S3 methods overwritten by 'ggpp':
#> method from
#> heightDetails.titleGrob ggplot2
#> widthDetails.titleGrob ggplot2
#> Warning: replacing previous import 'DataExplorer::plot_histogram' by
#> 'grafify::plot_histogram' when loading 'ClinicoPath'
#> Warning: replacing previous import 'ROCR::plot' by 'graphics::plot' when
#> loading 'ClinicoPath'
#> Warning: replacing previous import 'dplyr::select' by 'jmvcore::select' when
#> loading 'ClinicoPath'
#> Warning: replacing previous import 'tibble::view' by 'summarytools::view' when
#> loading 'ClinicoPath'
#>
#> Attaching package: 'ClinicoPath'
#> The following object is masked _by_ '.GlobalEnv':
#>
#> treatmentResponse
# data(treatmentResponse, package = "ClinicoPathDescriptives") # if needed
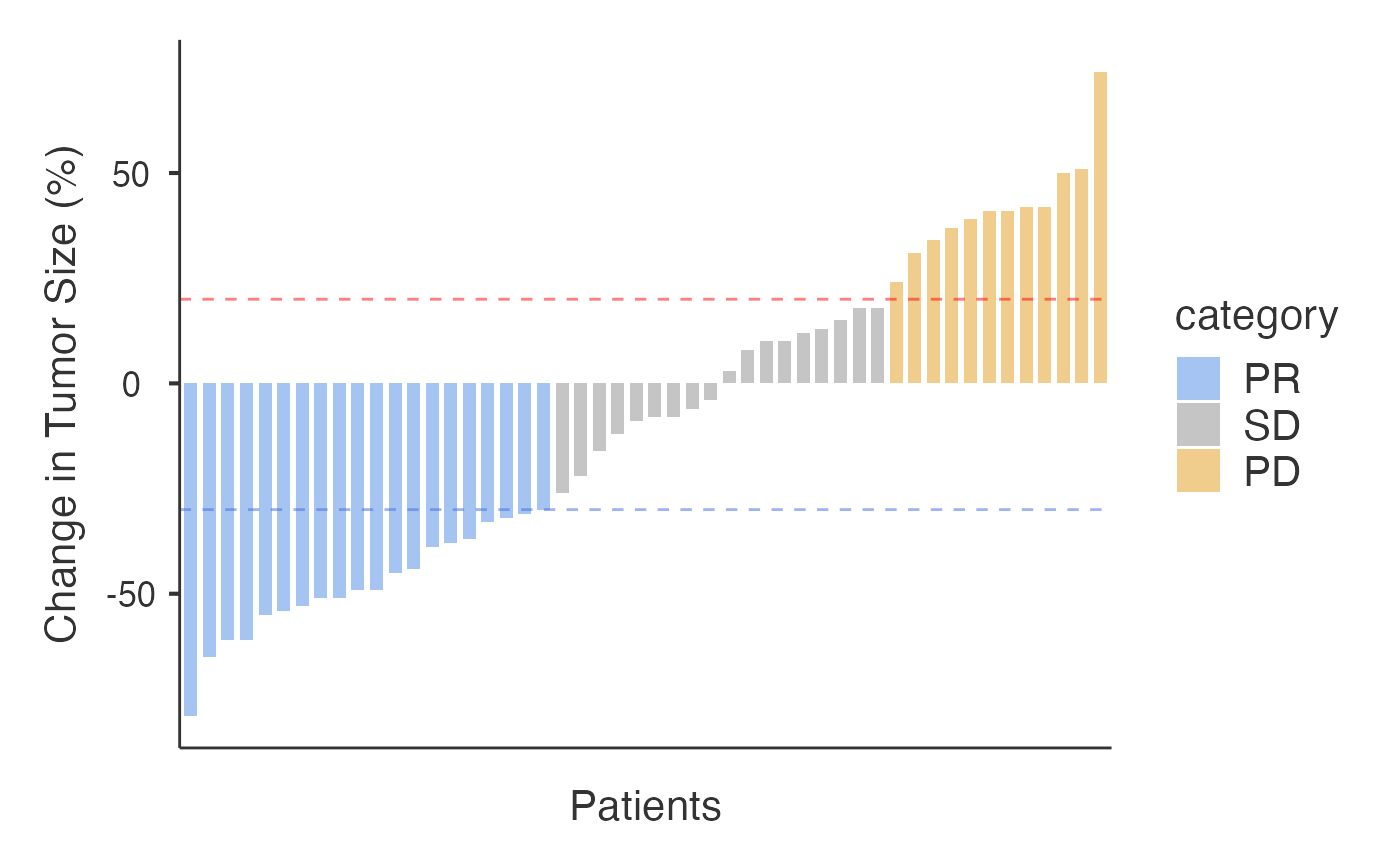
results_waterfall <- ClinicoPath::waterfall(
data = treatmentResponse,
patientID = "patientID",
responseVar = "change",
timeVar = NULL, # Not needed for percentage data
showThresholds = TRUE, # Show +20% and -30% RECIST thresholds
showWaterfallPlot = TRUE
)
# The waterfall function returns a jamovi results object
# The plot is rendered automatically when showWaterfallPlot = TRUE
# Display the results structure
if (!is.null(results_waterfall)) {
  print(results_waterfall)
} else {
  cat("Results object is NULL - check function execution above\n")
}
#>
#>  TREATMENT RESPONSE ANALYSIS
#>
#>  Response Categories Based on RECIST v1.1 Criteria
#>  ─────────────────────────────────────────────────
#>    Category    Number of Patients    Percentage
#>  ─────────────────────────────────────────────────
#>    CR     ᵃ                     0            0%
#>    PR     ᵇ                    20           40%
#>    SD     ᵈ                    18           36%
#>    PD     ᵉ                    12           24%
#>  ─────────────────────────────────────────────────
#>    ᵃ Complete Response (CR): Complete
#>    disappearance of all target lesions.
#>    ᵇ Partial Response (PR): At least 30%
#>    decrease in sum of target lesions.
#>    ᵈ Stable Disease (SD): Neither PR nor PD
#>    criteria met.
#>    ᵉ Progressive Disease (PD): At least 20%
#>    increase in sum of target lesions.
#>
#>
#>  Person-Time Analysis
#>  ──────────────────────────────────────────────────────────────────────────────────────────────────────────────────────
#>    Response Category    Patients    % Patients    Person-Time    % Time    Median Time to Response    Median Duration
#>  ──────────────────────────────────────────────────────────────────────────────────────────────────────────────────────
#>  ──────────────────────────────────────────────────────────────────────────────────────────────────────────────────────
#>
#>
#>  Clinical Response Metrics
#>  ────────────────────────────────────────────
#>    Metric                             Value
#>  ────────────────────────────────────────────
#>    Objective Response Rate (CR+PR)    40%
#>    Disease Control Rate (CR+PR+SD)    76%
#>  ────────────────────────────────────────────